Fig. 16.
Download original image
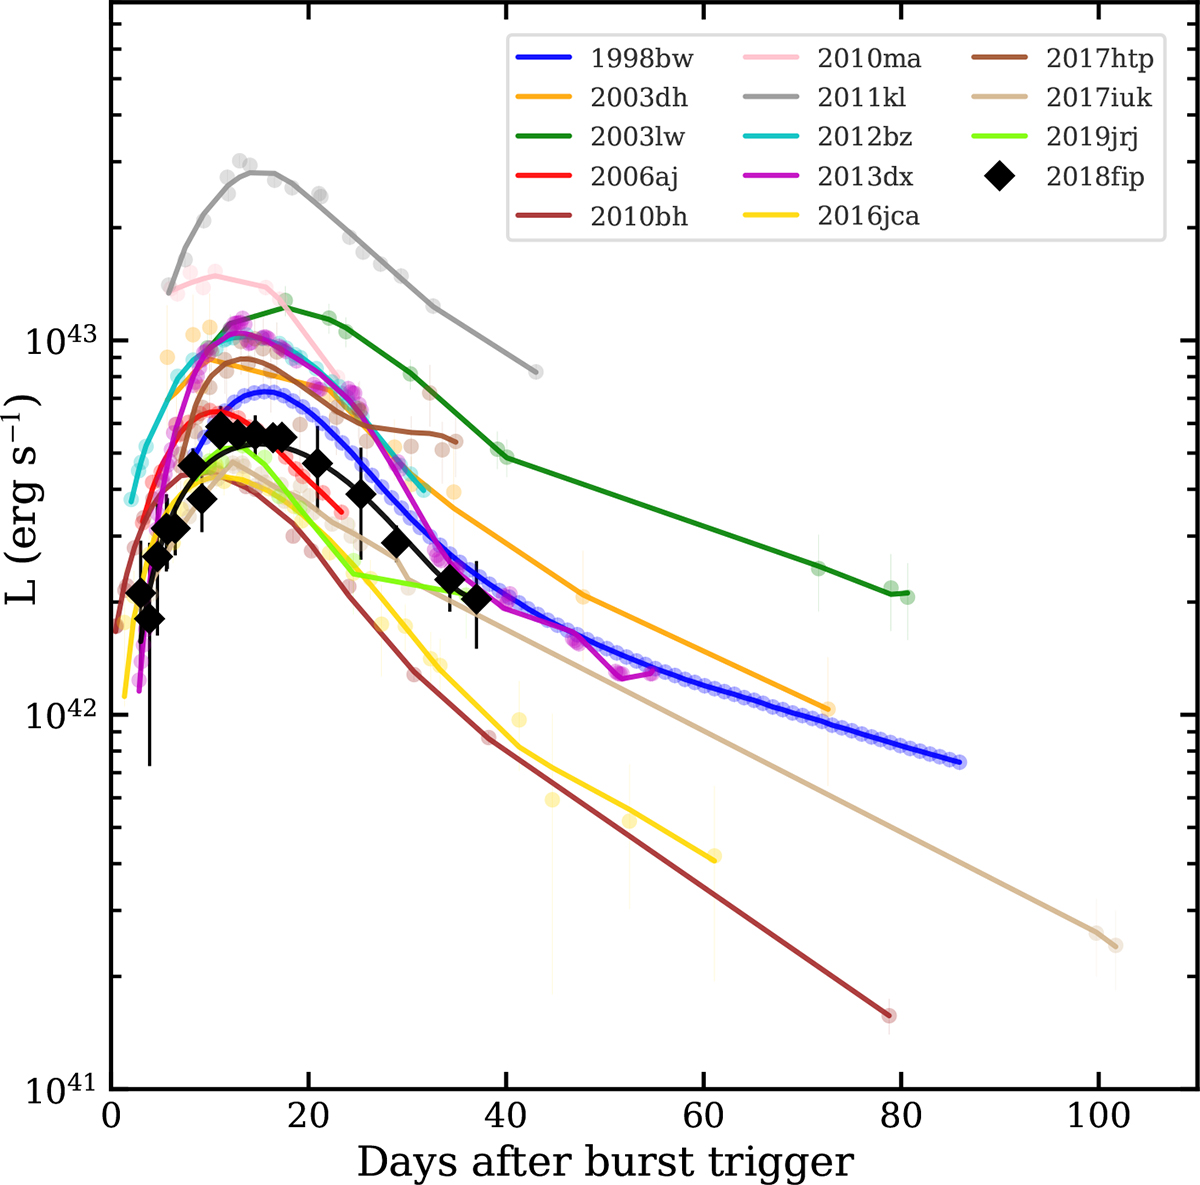
Quasi-bolometric light curve of SN 2018fip compared to those of 13 well-observed GRB-SNe, with low-order spline fits shown for each. Most of the comparison light curves, especially for GRB-SNe observed before 2015, are adopted from the compilation by Cano et al. (2017b), which incorporates data from multiple earlier studies cited therein. Additional events were included from more recent works by Cano et al. (2017a), Izzo et al. (2019), Melandri et al. (2019, 2022), Kumar et al. (2022, 2024).
Current usage metrics show cumulative count of Article Views (full-text article views including HTML views, PDF and ePub downloads, according to the available data) and Abstracts Views on Vision4Press platform.
Data correspond to usage on the plateform after 2015. The current usage metrics is available 48-96 hours after online publication and is updated daily on week days.
Initial download of the metrics may take a while.