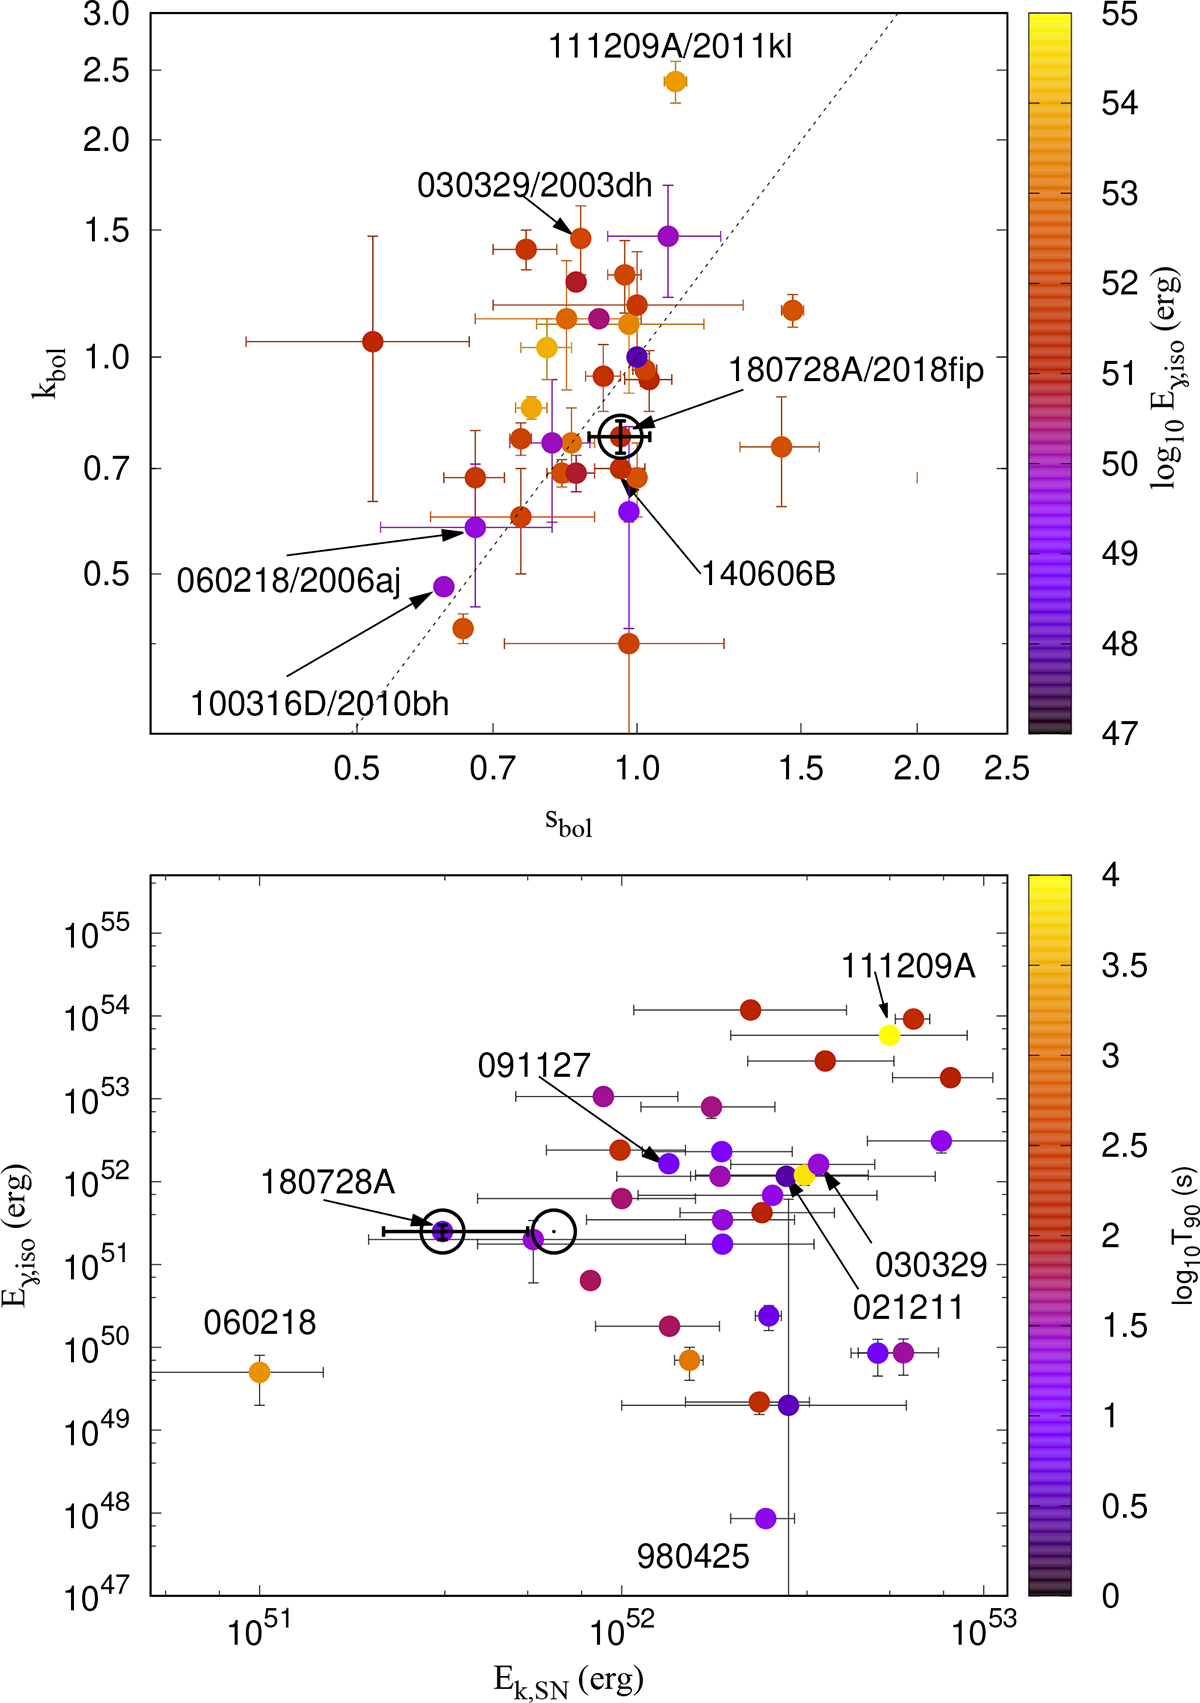
Fig. 17.
Download original image
Top: Luminosity–stretch diagram colour-coded by Eγ, iso. The dashed line is the best fit from (Klose et al. 2019). Bottom:Ek, SN – Eγ, iso plane, colour-coded by T90. Data are from (Cano et al. 2017b) and have been updated with recent results (Klose et al. 2019; Dainotti et al. 2022; Kann et al. 2024a; Dong et al. 2025). For SN 2018fip, the error on Ek, SN obtained via the Arnett modelling extends up to the one obtained by the spectral modelling and spherical approximation.
Current usage metrics show cumulative count of Article Views (full-text article views including HTML views, PDF and ePub downloads, according to the available data) and Abstracts Views on Vision4Press platform.
Data correspond to usage on the plateform after 2015. The current usage metrics is available 48-96 hours after online publication and is updated daily on week days.
Initial download of the metrics may take a while.