Open Access
Fig. 2.
Download original image
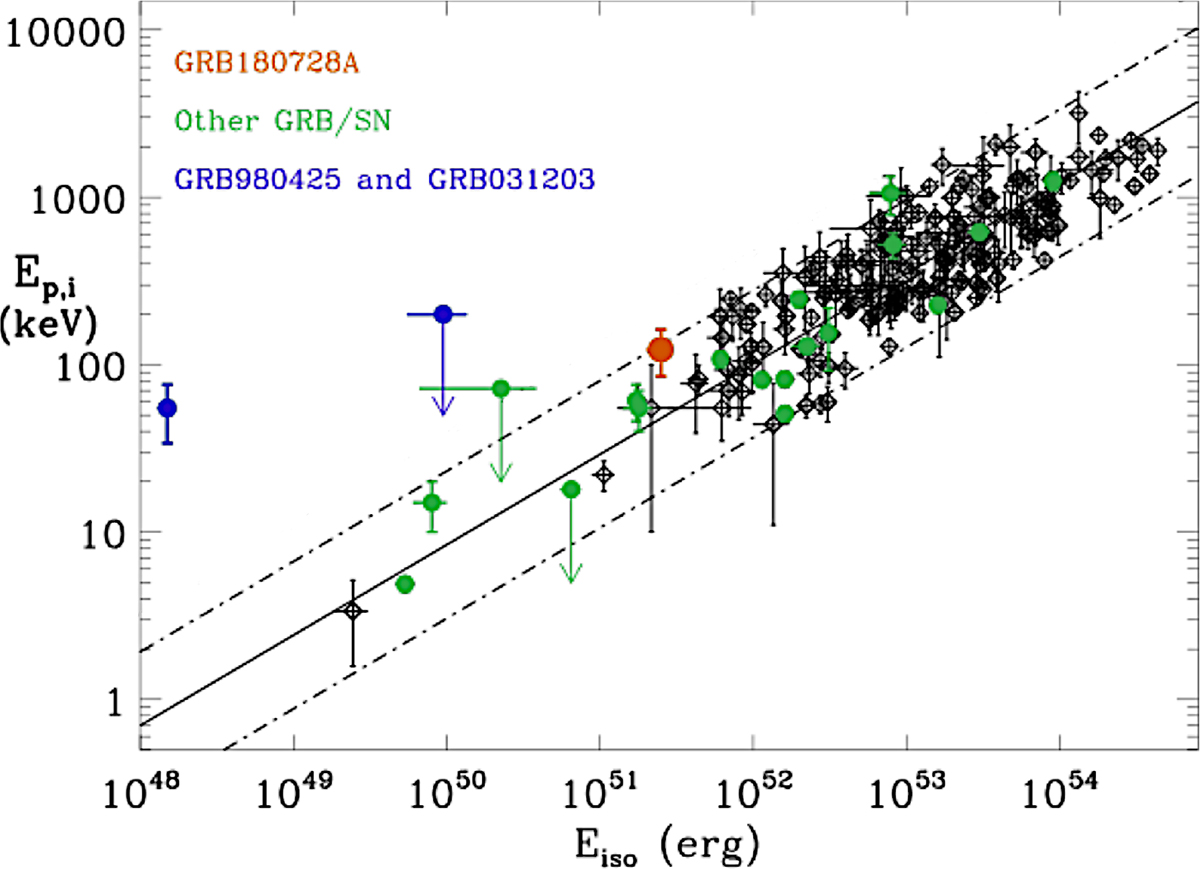
GRB 180728A (red) in the Ep, i − Eγ, iso plane. The GRBs with an associated SN are highlighted in green; outliers are in blue. Dot-dashed lines indicate the ±2σ region. The GRB data are from Amati et al. (2019).
Current usage metrics show cumulative count of Article Views (full-text article views including HTML views, PDF and ePub downloads, according to the available data) and Abstracts Views on Vision4Press platform.
Data correspond to usage on the plateform after 2015. The current usage metrics is available 48-96 hours after online publication and is updated daily on week days.
Initial download of the metrics may take a while.