Fig. C.2.
Download original image
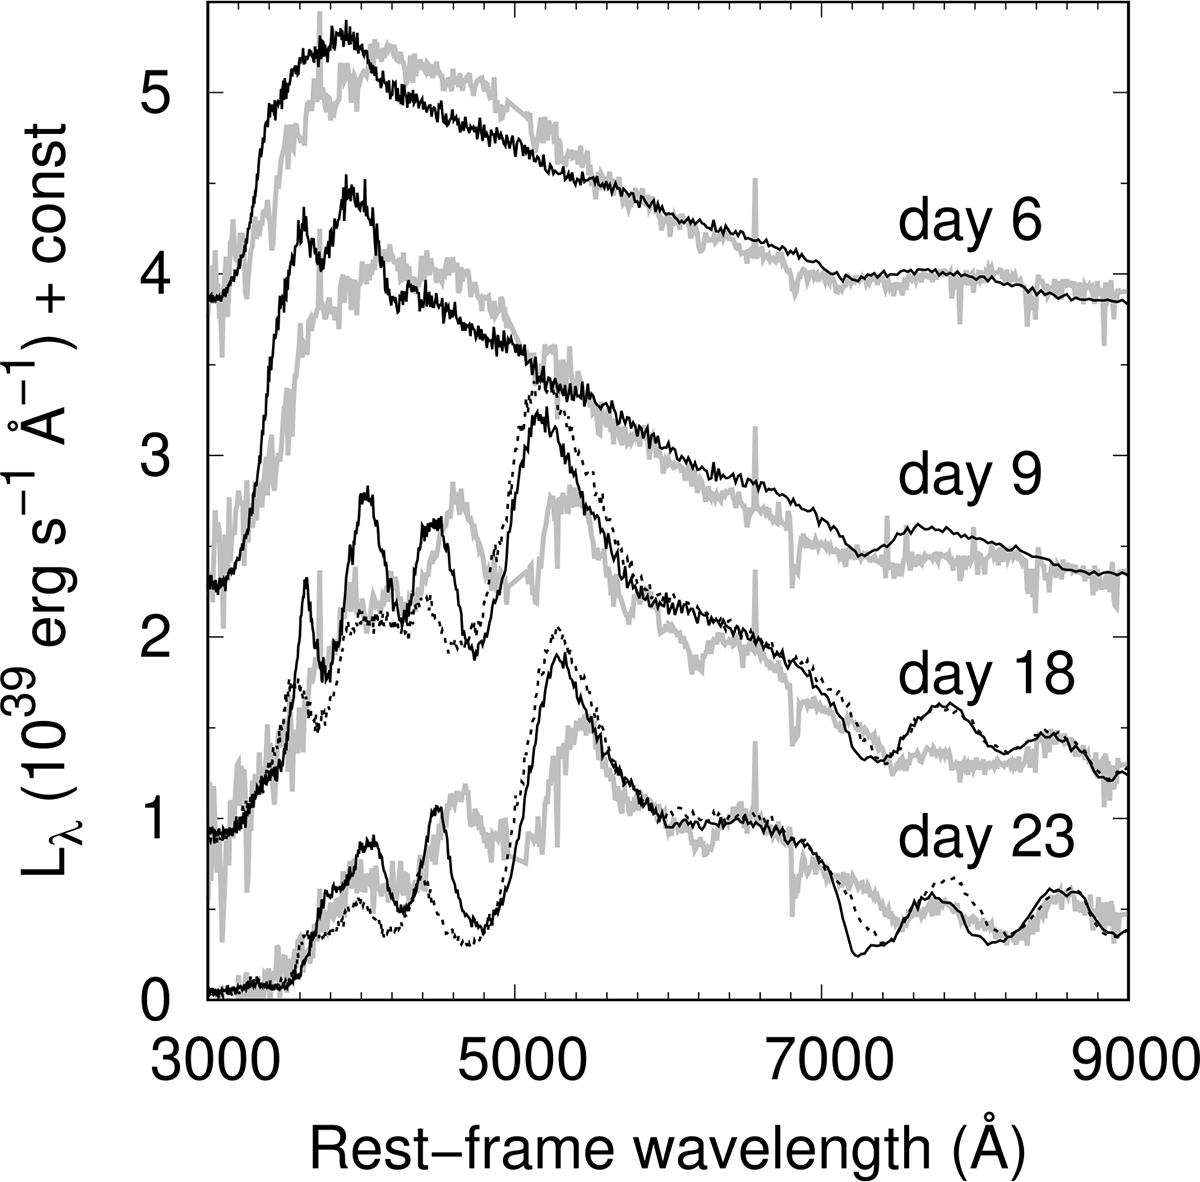
Another set of the spectral models that do not fit to the observed spectra. The solid curves show the synthesised spectra for the model in which the mass fractions of 56Ni and 58Ni are decreased by a factor of eight as compared to the reference model. The dashed curves adopt a pure C+O composition (plus the progenitor metals) for the high-velocity component. The grey lines show the observed spectra (see the caption of Fig. 7 for details).
Current usage metrics show cumulative count of Article Views (full-text article views including HTML views, PDF and ePub downloads, according to the available data) and Abstracts Views on Vision4Press platform.
Data correspond to usage on the plateform after 2015. The current usage metrics is available 48-96 hours after online publication and is updated daily on week days.
Initial download of the metrics may take a while.