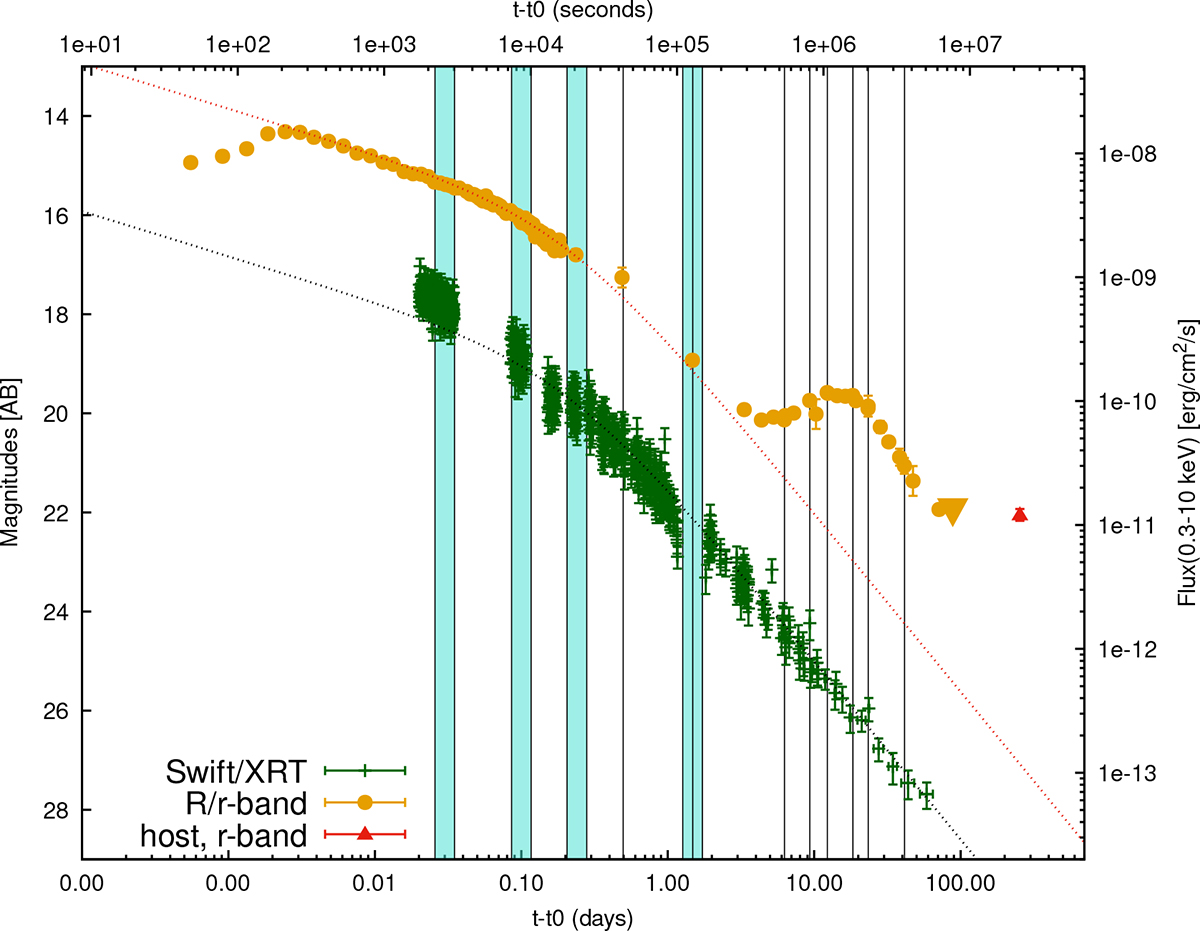
Fig. 5.
Download original image
Swift/XRT and optical light curves (MASTER CR band, X-shooter, GROND r′). Note that the optical data of the transient were obtained via image subtraction after 0.2 days, and therefore the contribution of the host is also subtracted. We highlight in cyan the epochs used in the optical-to-XRT SED fitting. Vertical lines highlight epochs with spectroscopic coverage. The dotted lines are the best fit of the optical light curve obtained in Section 4.2, which we have also normalised to the X-rays for data after 5 ks, i.e., excluding the first Swift orbit, which clearly shows that these early data are offset from the fit (see Sect. 4.3).
Current usage metrics show cumulative count of Article Views (full-text article views including HTML views, PDF and ePub downloads, according to the available data) and Abstracts Views on Vision4Press platform.
Data correspond to usage on the plateform after 2015. The current usage metrics is available 48-96 hours after online publication and is updated daily on week days.
Initial download of the metrics may take a while.