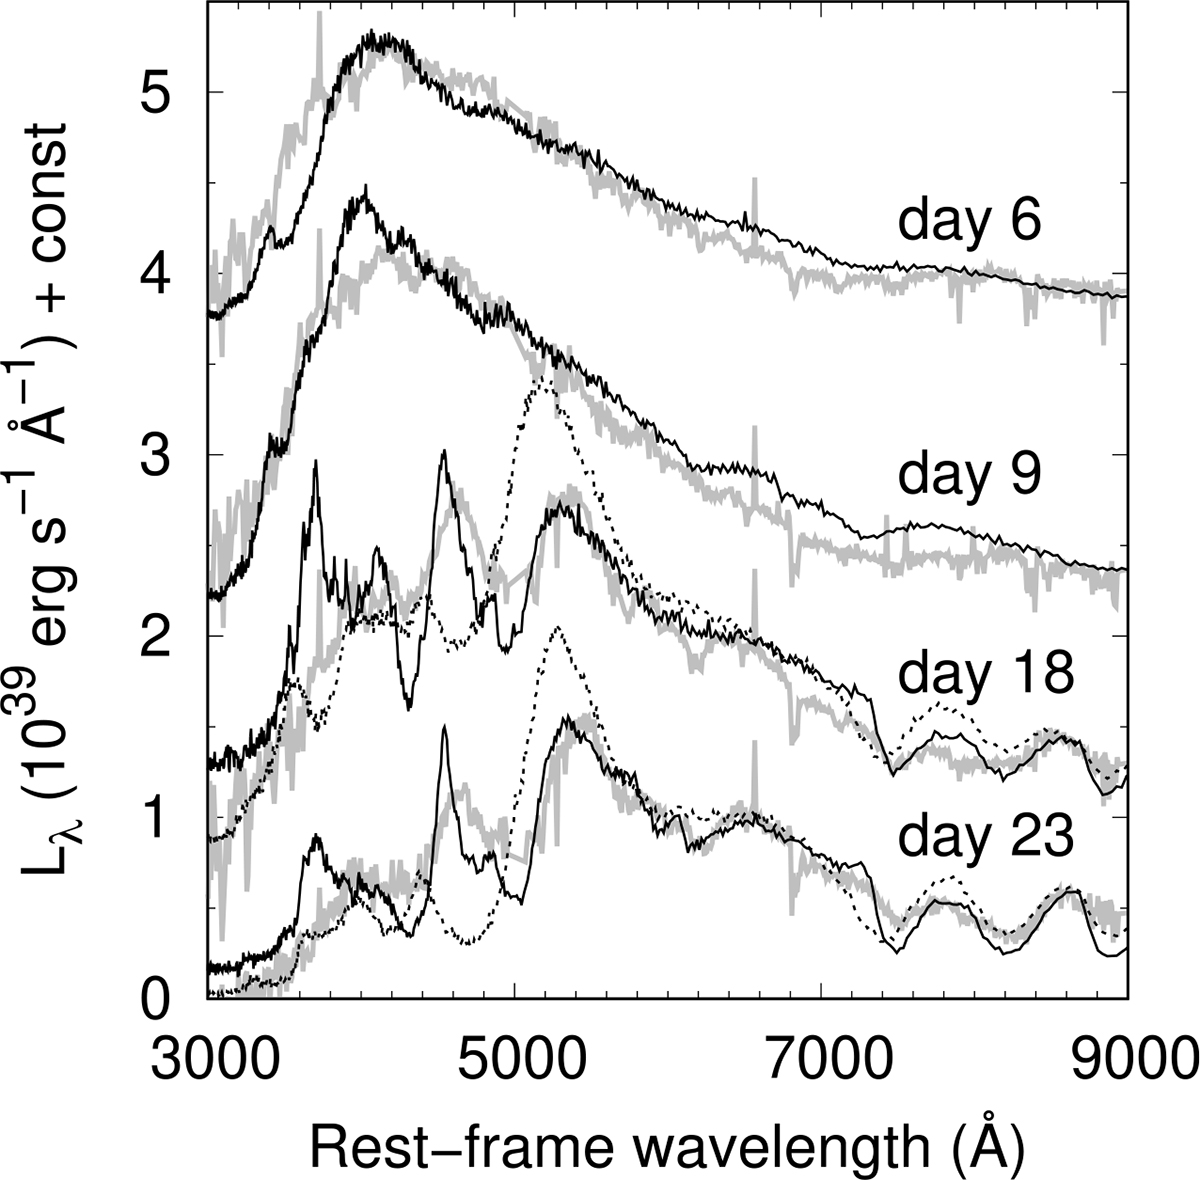
Fig. 7.
Download original image
Synthesised spectra as compared with those of SN 2018fip. Solid black lines represent the reference model spectra. The dashed black lines (on days 18 and 23) show the synthesised spectra with the high-velocity component included in the spectral synthesis calculations, demonstrating that this component is not present at late epochs. The observed spectra are shown with grey lines. The same constant in flux has been added for the model and data as an offset for presentation purposes (3.6, 2.0, 0.8, and 0.0 for day 6, 9, 18 and 23, respectively).
Current usage metrics show cumulative count of Article Views (full-text article views including HTML views, PDF and ePub downloads, according to the available data) and Abstracts Views on Vision4Press platform.
Data correspond to usage on the plateform after 2015. The current usage metrics is available 48-96 hours after online publication and is updated daily on week days.
Initial download of the metrics may take a while.