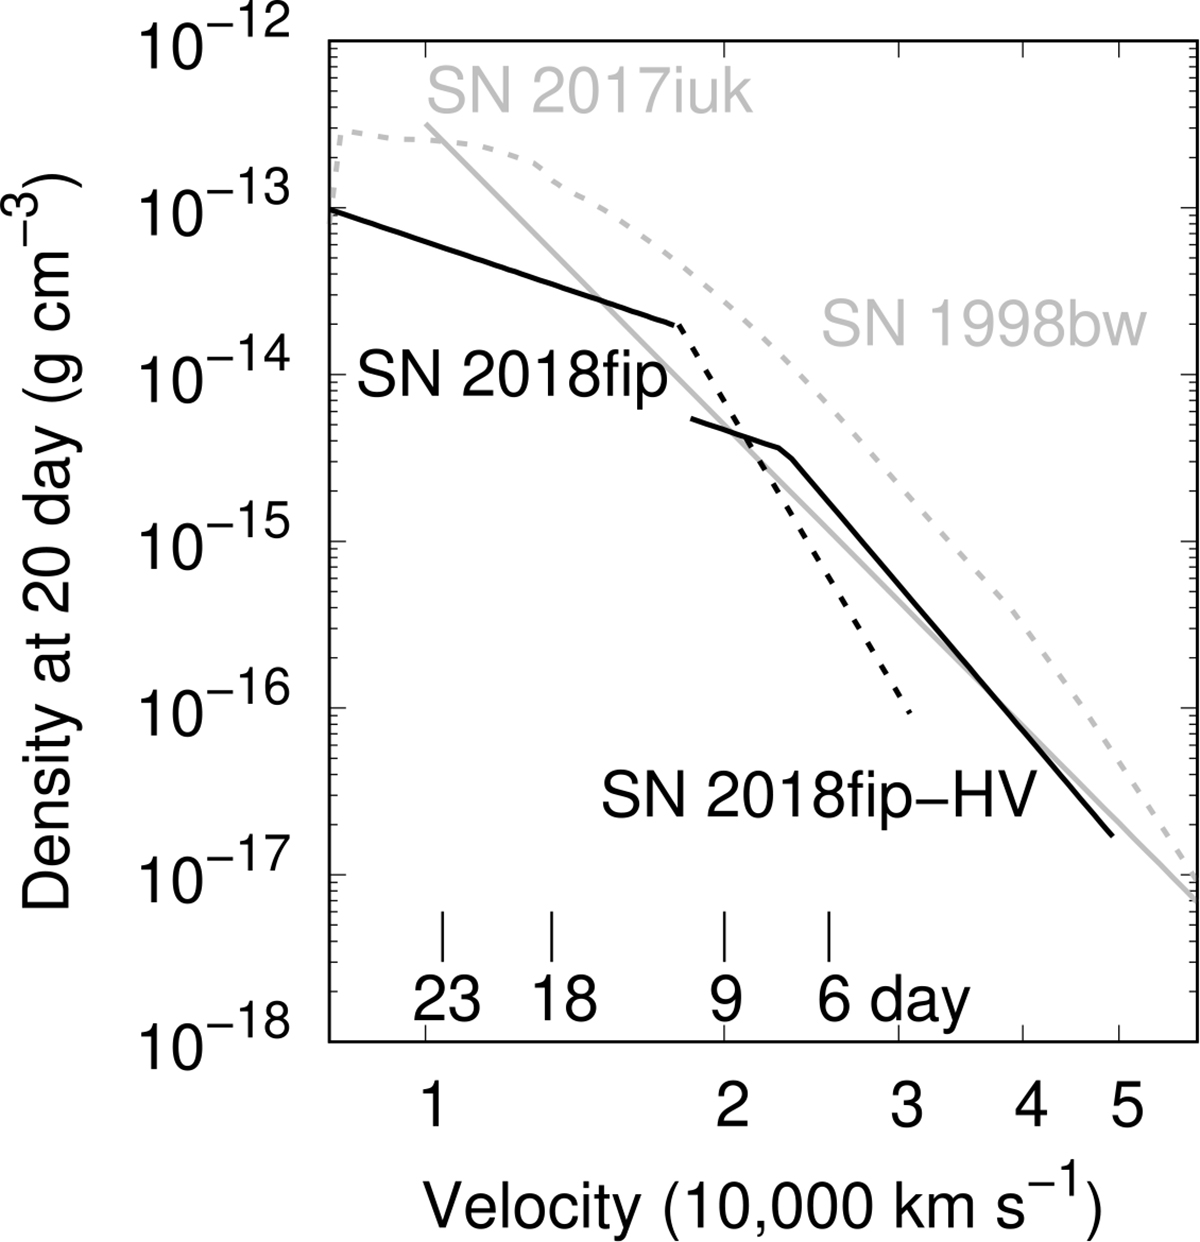
Fig. 8.
Download original image
Input density structure for the reference spectral model (solid black lines): the inner lower-velocity component for the spectra on day 18 and 23 (SN 2018fip) and the outer high-velocity component for day six and nine (SN 2018fip-HV). The dashed black line shows the upper limit set by the spectral synthesis analyses on days 18 and 23 (see the main text). The density structures derived for GRB-SNe 2017iuk (Izzo et al. 2019) and 1998bw (Iwamoto et al. 1998) are shown by solid grey and dashed grey lines, respectively.
Current usage metrics show cumulative count of Article Views (full-text article views including HTML views, PDF and ePub downloads, according to the available data) and Abstracts Views on Vision4Press platform.
Data correspond to usage on the plateform after 2015. The current usage metrics is available 48-96 hours after online publication and is updated daily on week days.
Initial download of the metrics may take a while.