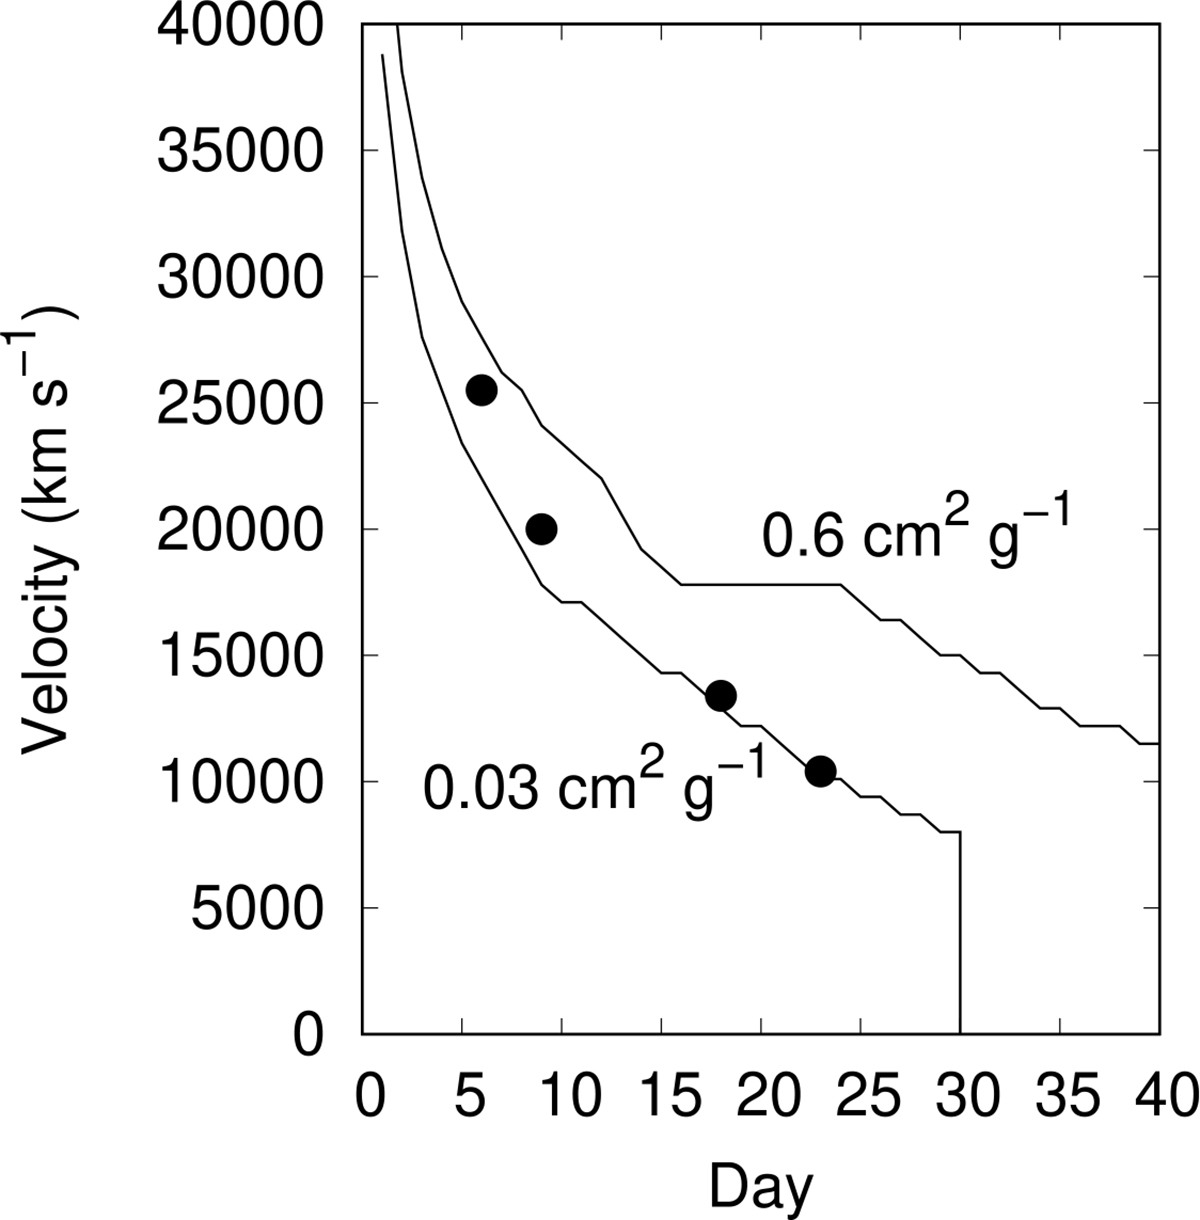
Fig. 9.
Download original image
Photospheric velocity used in the reference model (points). The two solid curves show the expected evolution of the photospheric velocity calculated for the reference density structure adopting a constant opacity of 0.03 or 0.6 cm2 g−1. In TARDIS spectral synthesis simulations, the input photospheric velocity is varied as a parameter within the range between the two lines shown here (see Sect. 4.6).
Current usage metrics show cumulative count of Article Views (full-text article views including HTML views, PDF and ePub downloads, according to the available data) and Abstracts Views on Vision4Press platform.
Data correspond to usage on the plateform after 2015. The current usage metrics is available 48-96 hours after online publication and is updated daily on week days.
Initial download of the metrics may take a while.