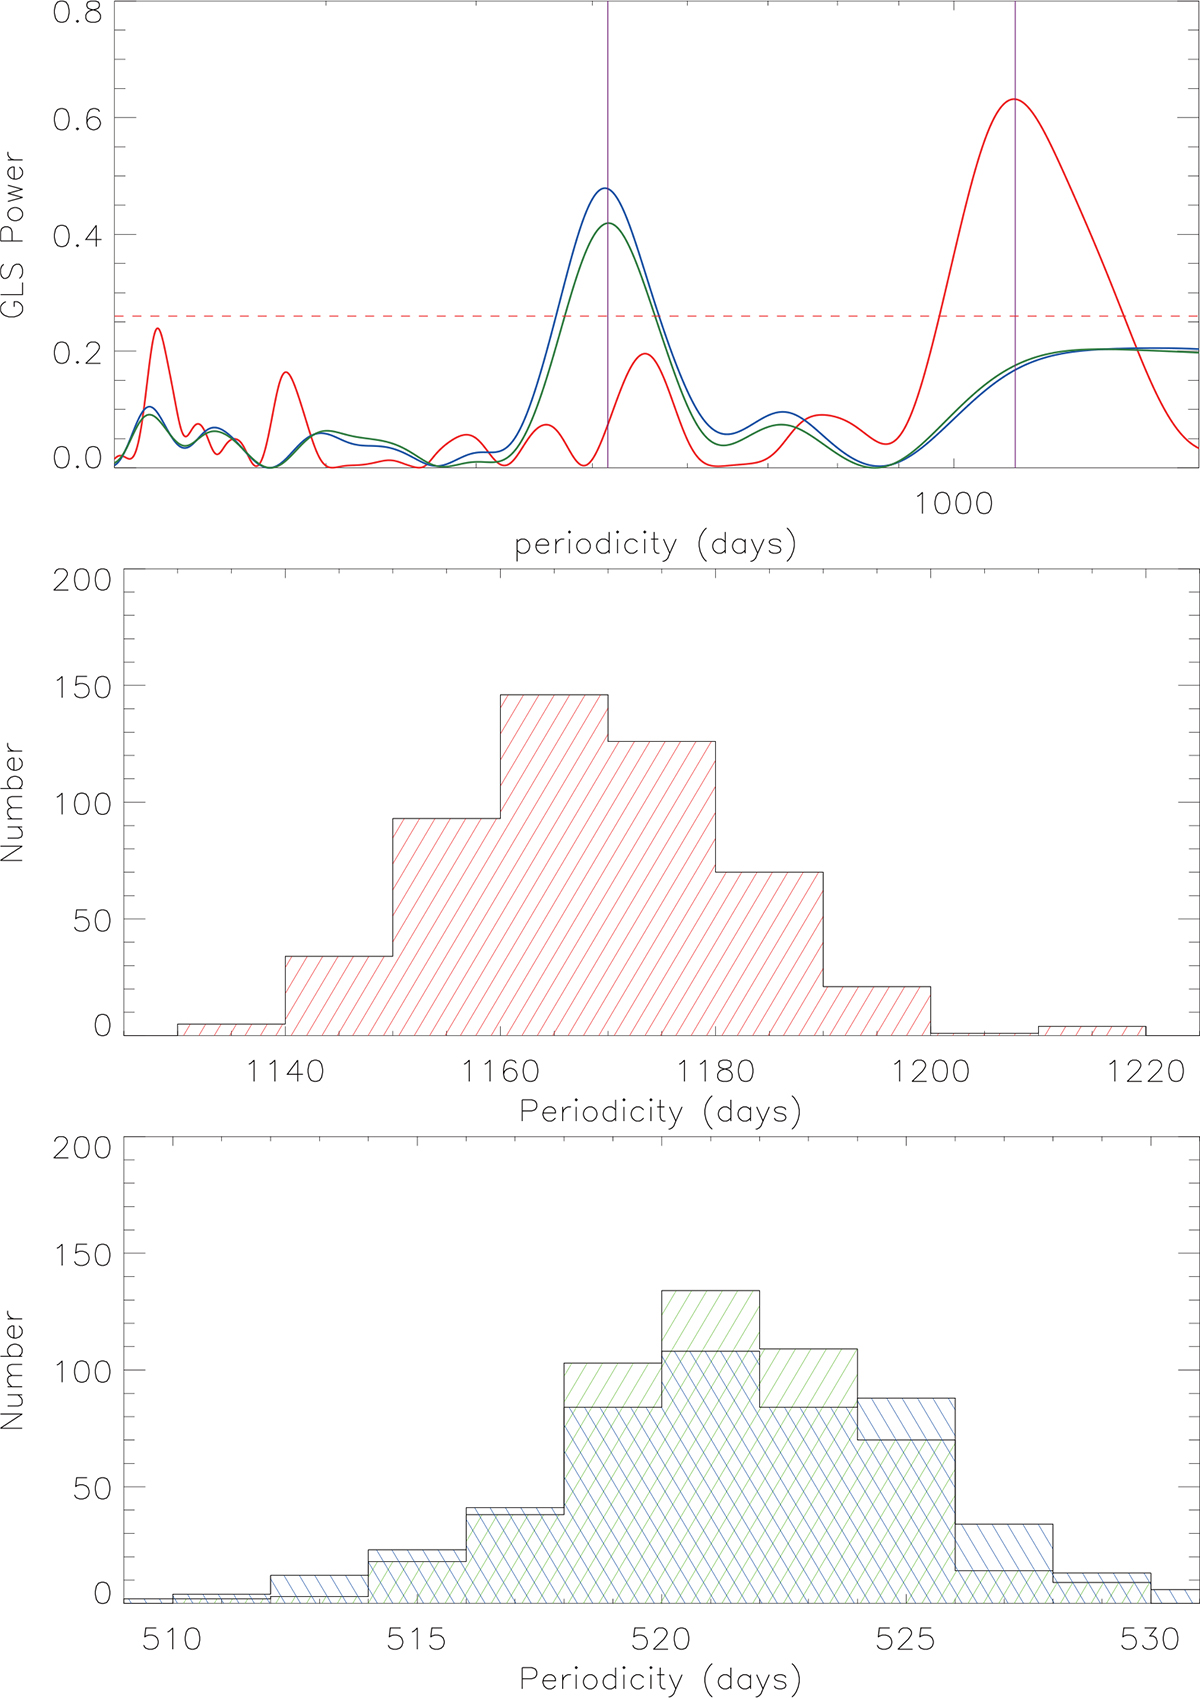
Fig. 2.
Download original image
Top: GLS periodograms of light curves. Solid red, blue, and green lines show the corresponding results from the CSS V-band and ZTF r- and g-band light curves. The horizontal dashed red lines indicate the corresponding 5σ significance level (FAP = 3e-7). Middle and bottom: Distributions of the periodicity determined via the bootstrap method from the CSS V-band light curve and the ZTF g- and r-band light curves.
Current usage metrics show cumulative count of Article Views (full-text article views including HTML views, PDF and ePub downloads, according to the available data) and Abstracts Views on Vision4Press platform.
Data correspond to usage on the plateform after 2015. The current usage metrics is available 48-96 hours after online publication and is updated daily on week days.
Initial download of the metrics may take a while.