| Issue |
A&A
Volume 708, April 2026
|
|
|---|---|---|
| Article Number | L4 | |
| Number of page(s) | 4 | |
| Section | Letters to the Editor | |
| DOI | https://doi.org/10.1051/0004-6361/202557668 | |
| Published online | 26 March 2026 | |
Letter to the Editor
Optical quasi-periodic oscillations of the quasar 4C 50.43 with different periodicities in CSS and ZTF light curves
Guangxi Key Laboratory for Relativistic Astrophysics, School of Physical Science and Technology, GuangXi University, No. 100, Daxue Road, Nanning 530004, PR China
★ Corresponding author: This email address is being protected from spambots. You need JavaScript enabled to view it.
Received:
13
October
2025
Accepted:
9
March
2026
Abstract
Long-standing optical quasi-periodic oscillations (QPOs) with periodicities of hundreds to thousands of days have been accepted as indicators of central sub-parsec binary black hole systems in broad line active galactic nuclei (BLAGNs). However, there are so far no direct reports confirming whether such optical QPOs have constant periodicities. Here, based on different methods applied to the light curves of 4C 50.43 detected at different times, an optical QPO with a periodicity of 1124 days was detected in the CSS V-band light curve, while a shorter periodicity of 513 days was detected in the ZTF g- and r-band light curves. Despite the two periodicities near-harmonic 2:1 ratio, the fact that they were not simultaneously detected in the Lomb-Scargle periodograms of the ZTF light curves suggests that they are not harmonically related. We considered potential factors to explain these two distinct periodicities, notably different temporal coverages, signal-to-noise ratios, and time steps between the CSS and ZTF light curves, as well as the effects of red noises related to intrinsic active galactic nucleus variability. Our analysis shows that red noises have a strong influence on the periodicities in 4C 50.43, which is in line with our previous simulations. Our results strongly indicate that caution should be taken when applying optical QPOs in BLAGNs with strong intrinsic active galactic nucleus variability.
Key words: galaxies: active / galaxies: nuclei / quasars: supermassive black holes / quasars: individual: 4C 50.43
© The Authors 2026
 Open Access article, published by EDP Sciences, under the terms of the Creative Commons Attribution License (https://creativecommons.org/licenses/by/4.0), which permits unrestricted use, distribution, and reproduction in any medium, provided the original work is properly cited.
This article is published in open access under the Subscribe to Open model. This email address is being protected from spambots. You need JavaScript enabled to view it. to support open access publication.
1. Introduction
Long-standing optical quasi-periodic oscillations (QPOs) observed in long-term light curves of broad line active galactic nuclei (BLAGNs) have been proposed as potential indirect indicators of central sub-parsec binary black hole systems (BBHs). Based on detected optical QPOs with periodicities ranging from hundreds to thousands of days, over 200 sub-parsec BBH candidates have been detected. Graham et al. (2015b) identified 111 potential candidates from large-scale time-domain surveys, and Charisi et al. (2016) confirmed 50 quasars that exhibit significant QPOs. Regarding individual sources, PG 1302-102 exhibits a periodicity of about 1800 days (Graham et al. 2015a) and PSO J334.2028+01.4075 a periodicity of 542 days (Liu et al. 2015), while SDSS J015910.05+010514.5 (Zheng et al. 2016) and SDSS J025214.67-002813.7 (Liao et al. 2021) show periodicities of 1500 days and 1607 days, respectively. Compelling cases have also been found in nearby active galactic nuclei (AGNs), such as Mrk 915 with 1150-day QPOs (Serafinelli et al. 2020) and Mrk 231 with 1.2-year QPOs (Kovacevic et al. 2020). In addition, we have reported several optical QPOs: 6.4-year QPOs in SDSS J0752 (Zhang 2022a), 3.8-year QPOs in SDSS J1321 (Zhang 2022b), 340-day QPOs in SDSS J1609 (Zhang 2023a), 1000-day QPOs in SDSS J1257 (Zhang 2023b), and 550-day QPOs in the quasar PG 1411+442 (Zhang 2025b).
However, whether QPOs truly exist remains a matter of debate, though these studies provide important indirect evidence for the existence of sub-parsec BBHs. Red noises related to intrinsic AGN variability may produce similar periodic features, as first discussed in Vaughan et al. (2016) and later in Zhang (2023a,b, 2025a) and Liao et al. (2025). Moreover, the effects of intrinsic AGN variability on the detected optical QPOs, especially whether it causes the detected QPOs to significantly deviate from the real intrinsic QPOs, has not been discussed in depth. Our recent simulation study (Zhang 2025b) tackled this question; we found that in 41.52% of simulated light curves created in sub-parsec BBHs, the detected QPOs deviated significantly from the input orbital period, often being two to four times the orbital period.
Although in Zhang (2025b) we proposed that AGN variability can affect the periodicity of QPOs, no relevant examples directly support this hypothesis. In this manuscript, we report on a distinctive source, 4C 50.43, identified as a sub-parsec BBH candidate with optical QPOs that have a periodicity of about 1125 days, as confirmed by Graham et al. (2015b) based on the Catalina Sky Survey (CSS). However, a significantly shorter period of about 513 days was detected in optical light curves collected by the Zwicky Transient Facility (ZTF; Bellm et al. 2019; Dekany et al. 2020). This is the first report of a period discrepancy of optical QPOs in different time periods. The structure of this manuscript is as follows: Section 2 presents the analysis of optical QPOs in both the CSS and ZTF light curves. Section 3 discusses the possible explanations for the periodicity discrepancy, and Sect. 4 summarizes our main conclusions. Throughout the manuscript, we adopt the cosmological parameters H0 = 70 km s−1 Mpc−1, Ωm = 0.3, and ΩΛ = 0.7.
2. Optical QPOs in 4C 50.43
The CSS V-band light curve of 4C 50.43 (MJD-53000 from 505 to 4505, i.e., May 2005 to April 2016) and the ZTF g- and r-band light curves (MJD-53000 from 5204 to 7489, i.e., March 2018 to June 2024) are shown in top panels of Fig. 1. The ZTF i-band light curve is not included, as it contains relatively few data points. To improve the accuracy and reliability of optical QPO detections, the direct fitting method, the phase-folding method, and the generalized Lomb-Scargle (GLS) method (VanderPlas 2018) have been applied.
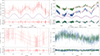 |
Fig. 1. Light curve fitting results of the CSS V band (left, red symbols) and the ZTF g and r bands (right, blue and green symbols). First row: Direct sinusoidal fitting results. In the top panel, the solid red and dashed orange lines show the best-fitting results and corresponding 5σ confidence bands from a sinusoidal function plus a fifth-degree polynomial component. The dashed purple lines represent the polynomial components, and the solid purple lines represent the determined sinusoidal components. Second row: Phase-folded fitting results. In the top panel, the solid red and dashed orange lines show the best-fitting results and the corresponding 5σ confidence bands. The bottom panels of each row display the corresponding residuals (light curves minus the best-fitting results), with solid red lines showing residuals = 0. |
The collected light curves are described using a direct sinusoidal fitting approach that incorporates the long-term trends of both a fifth-degree polynomial and a periodic sinusoidal component. The sinusoidal function was only used to model the periodic structure in the light curves. We determined the best-fitting results using the Levenberg-Marquardt least squares technique. They are shown in the top panels of Fig. 1, with χ2/d.o.f. ∼ 0.4 and a determined periodicity of 1122 ± 24 days in the CSS V-band light curve, and with χ2/d.o.f. ∼ 1.9 and a determined periodicity of 512 ± 16 days in the ZTF g- and r-band light curves.
Further, after subtracting the polynomial components, we phase-folded the light curves based on the determined periodicity. A sinusoidal function was then used to describe the folded light curves. The fitting results are shown in the bottom panels of Fig. 1 with a χ2/d.o.f. of ∼ 0.4 for the folded CSS V-band light curve and a χ2/d.o.f. of ∼ 2.1 for the folded ZTF g- and r-band light curves.
We used the GLS method to check the robustness of the QPO detections. The top panel of Fig. 2 presents the GLS powers of the light curves. A significant peak at approximately 1125 days is detected in the CSS V band (solid red line), while the ZTF g and r bands (solid blue and green lines, respectively) exhibit prominent peaks around 515 days. All detected primary peaks exceed the 5σ significance level, with a false alarm probability (FAP) of 3e-7, as determined using the bootstrap method.
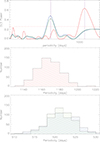 |
Fig. 2. Top: GLS periodograms of light curves. Solid red, blue, and green lines show the corresponding results from the CSS V-band and ZTF r- and g-band light curves. The horizontal dashed red lines indicate the corresponding 5σ significance level (FAP = 3e-7). Middle and bottom: Distributions of the periodicity determined via the bootstrap method from the CSS V-band light curve and the ZTF g- and r-band light curves. |
The uncertainty associated with the GLS-determined periodicity is defined as half the full width at half maximum of the distribution of the peak periodicity obtained through bootstrap resampling within 1000 loops. The original light curve was resampled 1000 times, with each resampled set comprising a random selection of more than half of the original data points. The bootstrap-determined distributions of the periodicities are shown in middle and bottom panels of Fig. 2.
Quasi-periodic oscillations with periods of 1122 ± 24 days and 512 ± 16 days were detected in the CSS V-band and ZTF g- and r-band light curves using both the direct method and the phase-folded method. Similar periods of 1125 ± 40 days and 515 ± 4 days were identified using the GLS method. The consistency of these results from different methods reinforces the reliability of the findings, collectively suggesting the presence of significant QPOs with periods of around 1124 ± 64 days in the CSS V band, consistent with that reported by Graham et al. (2015b). While the ZTF g and r bands show a periodicity of around 513 ± 20 days, it differs from that detected in the CSS band. Although the ratio of the two periodicities exhibits a near integer multiple of 2 relationship, the absence of simultaneous significant peaks around 1125 days in the GLS periodogram (Fig. 2) of the ZTF g and r bands suggests a lack of harmonic coherence.
The probability of optical QPOs in 4C 50.43 related to intrinsic AGN variability (red noises) can be determined in a simple way. The intrinsic AGN variability was simulated using the continuous auto-regressive (CAR) process (Kell et al. 2009):
 (1)
(1)
where ϵ(t) denotes a white noise process with zero mean and unit variance. The mean magnitude (bdt) was sampled from the typical range of 16–19 mag for low-redshift quasars. The relaxation timescale (τ) was randomly selected within the range of 100–1000 days, in line with the typical quasar values reported in Kell et al. (2009) and MacLeod (2010). The parameter  , which corresponds to the variances of simulated light curves, was randomly sampled within the typical range of variance values in the ZTF light curves of Sloan Digital Sky Survey (SDSS) quasars, from 0.001 to 0.32. The uncertainties (LMCerr) of the simulated light curves (LMC) were determined based on the relative uncertainties in the observed light curves,
  . The time information, t = [tcss, tztf], is the combined time information of CSS V-band and ZTF g-band light curves of 4C 50.43. Then, among 1e6 simulated light curves, 113 light curves were collected according to the following criteria: The GLS-determined periodicity in the simulated light curve with t = tcss (t = tztf) should be longer than 1124-128 days (513-80 days) and shorter than 1124+128 days (513+80 days) and have a corresponding peak value in the GLS powers higher than 0.5 (0.4) (peak values larger than 0.6 and 0.5 in CSS and ZTF for 4C 50.43). Therefore, the probability is 99.99% (1–113/1e6), or a corresponding confidence level higher than 4σ, that the detected optical QPOs in 4C 50.43 are not from intrinsic AGN variability.
3. Potential causes of QPO detection inconsistencies between CSS V and ZTF g and r bands
Given the significant wavelength overlap between the CSS V and ZTF g and r bands, they probe similar regions of the accretion disk. The periodicity discrepancy is therefore unlikely to reflect a radial dependence; instead, it is more likely attributable to red noise, as well as variations in the signal-to-noise ratio (S/N), temporal coverage, and time steps between the CSS and ZTF light curves.
As detailed in Zhang (2025a), the effects of intrinsic AGN variability can explain the periodicity discrepancy of optical QPOs in 4C 50.43 in different wavelength bands and at different times. We applied an additional oversimplified method to re-check the effects of red noises related to intrinsic AGN variability. The intrinsic AGN variability (red noises) was similarly simulated using the CAR process, but with time information set to be tztf of the ZTF g-band light curve of 4C 50.43. The intrinsic QPOs were then introduced into the red-noise-dominated light curves in the form of a sinusoidal function:  , with amplitude A randomly selected from the set [0.1, 0.2, 0.3, 0.4, 0.5, 0.6, 0.7, 0.8, 0.9, 1, 2, 3, 4, 5, 6, 7, 8, 9] and multiplied by the variance of the red noise. The periodicity (T) was randomly selected from the range 300–700 days. The simulated light curves, including QPOs and intrinsic AGN variability, can be created as S(t)+LMCt.
Based on this method, a total of 50 000 light curves were generated with the same information (t) as the ZTF g-band light curve of 4C 50.43 (including the observation timestamps and temporal sampling) thanks to high quality of g-band light curve. The corresponding periodicities of these simulated light curves were determined using the GLS method. The top-left panel of Fig. 3 presents the distribution of the ratio of the intrinsic periodicity (T) to the measured periodicity (To; with a significance level exceeding 5σ) derived from the simulation light curves using the GLS method. The results indicate that the majority of the ratios are inconsistent with 1, leading the influence of red noises on the intrinsic QPOs to become apparent. Meanwhile, among the 50 000 simulated light curves, 37 152 exhibited a periodicity ratio T/To ≤ 1.5. Meanwhile, 3042 showed substantial deviations, with some ratios reaching up to 4, suggesting that red noises significantly affect the accuracy of periodicity measurements. The remaining light curves were excluded from the statistical analysis due to the lack of a statistically significant periodicity. The results strongly indicate that effects of red noises can naturally explain the periodicity discrepancy in 4C 50.43.
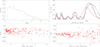 |
Fig. 3. Top left: Distribution of the ratio of the periodicity (T) to the measured periodicity detected via the GLS method applied in the simulated light curves, including sine component and intrinsic AGN variability. Top right: GLS periodograms of five light curves randomly selected from the CSS V-band light curves, with time spans of 2236 days, 2475 days, 2217 days, 2208 days, and 2466 days (in orange, green, red, blue, and purple, respectively), similar to that of the ZTF g band. Bottom panels: Periodicity ratios between each subset with varying time steps (bottom left) and varying S/Ns (bottom right) and the original ZTF g-band light curve. |
Considering only the temporal coverage of the ZTF light curves may not be sufficient to detect the 1124-day periodicity with statistical significance. Five light curves with time spans similar to that of the ZTF g band were randomly selected based on the existing CSS V-band light curves. The time spans of these light curves are 2236 days, 2475 days, 2217 days, 2208 days, and 2466 days, with the corresponding data points being 152, 220, 138, 154, and 226, and sampling frequencies of 0.068, 0.089, 0.062, 0.07, and 0.09 respectively. GLS analysis was performed on each of these light curves, with the results shown in top-right panel of Fig. 3.
The analysis reveals that QPOs in all five light curves are concentrated around 1124 days, indicating that such time spans are sufficient for identifying this periodicity. Furthermore, higher sampling frequencies yield more significant detections of the 1124-day QPO while reducing the significance of the 513-day periodicity. Given that the ZTF light curves possess comparable temporal coverage and sampling frequencies, the 1124-day periodicity would be detected if it were truly present. However, the ZTF light curves exhibit a dominant peak at 513 days with no significant detection at 1124 days. Therefore, the absence of the 1124-day periodicity in the ZTF light curves cannot be attributed to insufficient temporal coverage; rather, this periodicity likely does not exist in the ZTF light curve.
Due to the smaller time steps and higher S/Ns of the ZTF light curves compared to the CSS light curves, it is necessary to check whether the quality of the light curves can be used to explain the detected periodicity discrepancy in 4C 50.43, especially the effects of time steps and S/Ns. Then, the corresponding procedures to check such effects are done as follows.
To test the effects of the time steps, 200 subsets containing one-sixth to three-quarters of the original data points were randomly selected from the ZTF g-band light curve of 4C 50.43. To test the effects of the S/N, the original photometric uncertainties were scaled by factors randomly selected between 1 and 10 and added to the ZTF g-band light curve of 4C 50.43, with this process repeated 200 times. The periodicities of both sets of samples were determined using the GLS method, and the ratios of the resulting periodicity were compared to those of the original light curves. As shown in the bottom panels of Fig. 3, variations in time steps have only a limited impact on QPO detection, with the periodicity remaining largely consistent with that of the original ZTF g-band light curve of 4C 50.43. Meanwhile, the S/Ns also had an effect on the detected periodicities, leading to a difference of only approximately 5% between the intrinsic periodicities and the determined values. Therefore, the quality of the light curves is not a major cause of the detected periodicity discrepancy in 4C 50.43.
4. Conclusions
The detected periods of the optical QPOs of quasar 4C 50.43, as revealed by different methods, show a significant discrepancy that likely does not represent a harmonic relationship: 1124 days in the CSS V band and 513 days in the ZTF g and r bands. Through simulations based on the CAR process, with a confidence level higher than 4σ, we confirm that the detected optical QPOs in 4C 50.43 are not related to intrinsic AGN variability. Several possible mechanisms were considered to explain this difference, such as different temporal coverage and the quality of light curves, as well as the effects of red noises. We conclude that the periodicity difference is more likely caused by intrinsic AGN variability. At the current stage, although the unique periodicity discrepancy is only reported in 4C 50.43, the results presented here strongly indicate that caution should be taken when applying optical QPOs in BLAGNs with strong intrinsic variability leading to detected periodicities very different from intrinsic values.
Acknowledgments
The authors gratefully acknowledge the anonymous referee for giving us constructive comments to greatly improve the paper. Zhang gratefully acknowledges the kind grant support from NSFC-12373014 and 12173020 and the support from Guangxi Talent Programme (Highland of Innovation Talents). This paper has made use of the data from ZTF and CSS, and the MPFIT package, and the NASA/IPAC Extragalactic Database (NED).
References
- Bellm, E. C., Kulkarni, S. R., Barlow, T., et al. 2019, PASP, 131, 068003 [Google Scholar]
- Charisi, M., Bartos, I., Haiman, Z., et al. 2016, MNRAS, 463, 2145 [Google Scholar]
- Dekany, R., Smith, R. M., Riddle, R., et al. 2020, PASP, 132, 038001 [NASA ADS] [CrossRef] [Google Scholar]
- Graham, M. J., Djorgovski, S. G., Stern, D., et al. 2015a, Nature, 518, 74 [Google Scholar]
- Graham, M. J., Djorgovski, S. G., Stern, D., et al. 2015b, MNRAS, 453, 1562 [Google Scholar]
- Kell, B. C., Bechtold, J., & Siemiginowska, A. 2009, ApJ, 698, 895 [NASA ADS] [CrossRef] [Google Scholar]
- Kovacevic, A. B., Yi, T. F., Dai, X. Y., et al. 2020, MNRAS, 494, 4069 [CrossRef] [Google Scholar]
- Liao, W. T., Chen, Y. C., Liu, X., et al. 2021, MNRAS, 500, 4025 [NASA ADS] [Google Scholar]
- Liao, G. L., Chen, X. Q., Zheng, Q., Liu, Y. L., & Zhang, X. G. 2025, A&A, 698, A265 [NASA ADS] [CrossRef] [EDP Sciences] [Google Scholar]
- Liu, T. T., Gezari, S., Heinis, S., et al. 2015, ApJ, 803, L16 [NASA ADS] [CrossRef] [Google Scholar]
- MacLeod, C. L., et al. 2010, ApJ, 721, 1014 [Google Scholar]
- Serafinelli, R., Severgnini, P., Braito, V., et al. 2020, ApJ, 902, 10 [Google Scholar]
- VanderPlas, J. T. 2018, ApJS, 236, 16 [Google Scholar]
- Vaughan, S., Uttley, P., Markowitz, A. G., et al. 2016, MNRAS, 461, 3145 [Google Scholar]
- Zhang, X. G. 2022a, MNRAS, 512, 1003 [Google Scholar]
- Zhang, X. G. 2022b, MNRAS, 516, 3650 [Google Scholar]
- Zhang, X. G. 2023a, MNRAS, 525, 335 [Google Scholar]
- Zhang, X. G. 2023b, MNRAS, 526, 1588 [NASA ADS] [CrossRef] [Google Scholar]
- Zhang, X. G. 2025a, ApJ, 979, 147 [Google Scholar]
- Zhang, X. G. 2025b, ApJ, 983, 90 [Google Scholar]
- Zheng, Z. Y., Butler, N. R., Shen, Y., et al. 2016, ApJ, 827, 56 [Google Scholar]
All Figures
|
Fig. 1. Light curve fitting results of the CSS V band (left, red symbols) and the ZTF g and r bands (right, blue and green symbols). First row: Direct sinusoidal fitting results. In the top panel, the solid red and dashed orange lines show the best-fitting results and corresponding 5σ confidence bands from a sinusoidal function plus a fifth-degree polynomial component. The dashed purple lines represent the polynomial components, and the solid purple lines represent the determined sinusoidal components. Second row: Phase-folded fitting results. In the top panel, the solid red and dashed orange lines show the best-fitting results and the corresponding 5σ confidence bands. The bottom panels of each row display the corresponding residuals (light curves minus the best-fitting results), with solid red lines showing residuals = 0. |
| In the text | |
|
Fig. 2. Top: GLS periodograms of light curves. Solid red, blue, and green lines show the corresponding results from the CSS V-band and ZTF r- and g-band light curves. The horizontal dashed red lines indicate the corresponding 5σ significance level (FAP = 3e-7). Middle and bottom: Distributions of the periodicity determined via the bootstrap method from the CSS V-band light curve and the ZTF g- and r-band light curves. |
| In the text | |
|
Fig. 3. Top left: Distribution of the ratio of the periodicity (T) to the measured periodicity detected via the GLS method applied in the simulated light curves, including sine component and intrinsic AGN variability. Top right: GLS periodograms of five light curves randomly selected from the CSS V-band light curves, with time spans of 2236 days, 2475 days, 2217 days, 2208 days, and 2466 days (in orange, green, red, blue, and purple, respectively), similar to that of the ZTF g band. Bottom panels: Periodicity ratios between each subset with varying time steps (bottom left) and varying S/Ns (bottom right) and the original ZTF g-band light curve. |
| In the text | |
Current usage metrics show cumulative count of Article Views (full-text article views including HTML views, PDF and ePub downloads, according to the available data) and Abstracts Views on Vision4Press platform.
Data correspond to usage on the plateform after 2015. The current usage metrics is available 48-96 hours after online publication and is updated daily on week days.
Initial download of the metrics may take a while.