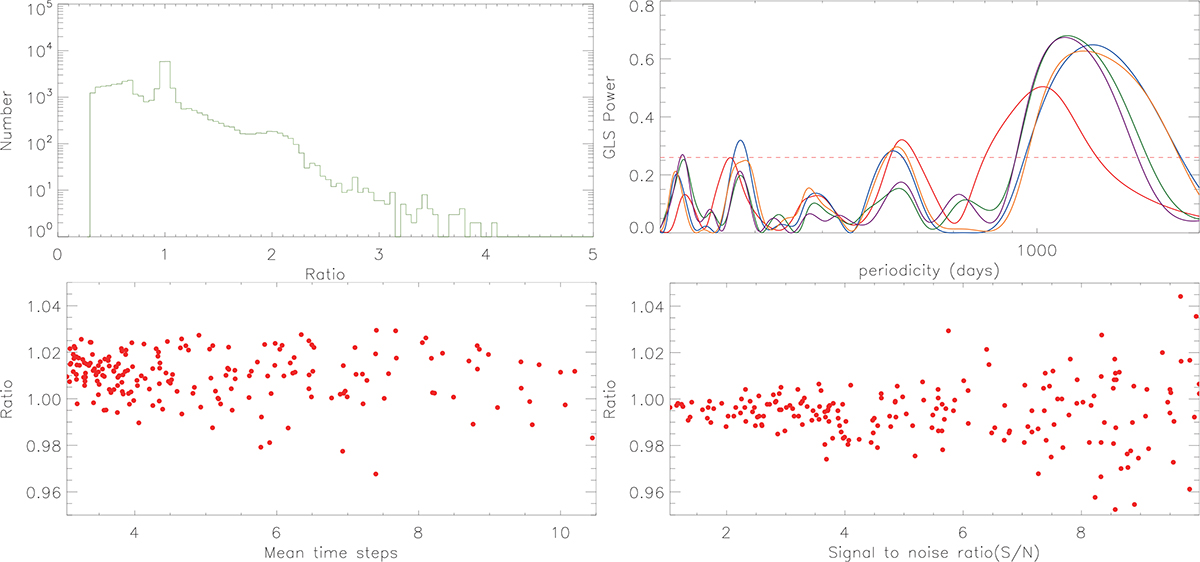
Fig. 3.
Download original image
Top left: Distribution of the ratio of the periodicity (T) to the measured periodicity detected via the GLS method applied in the simulated light curves, including sine component and intrinsic AGN variability. Top right: GLS periodograms of five light curves randomly selected from the CSS V-band light curves, with time spans of 2236 days, 2475 days, 2217 days, 2208 days, and 2466 days (in orange, green, red, blue, and purple, respectively), similar to that of the ZTF g band. Bottom panels: Periodicity ratios between each subset with varying time steps (bottom left) and varying S/Ns (bottom right) and the original ZTF g-band light curve.
Current usage metrics show cumulative count of Article Views (full-text article views including HTML views, PDF and ePub downloads, according to the available data) and Abstracts Views on Vision4Press platform.
Data correspond to usage on the plateform after 2015. The current usage metrics is available 48-96 hours after online publication and is updated daily on week days.
Initial download of the metrics may take a while.