Fig. 11
Download original image
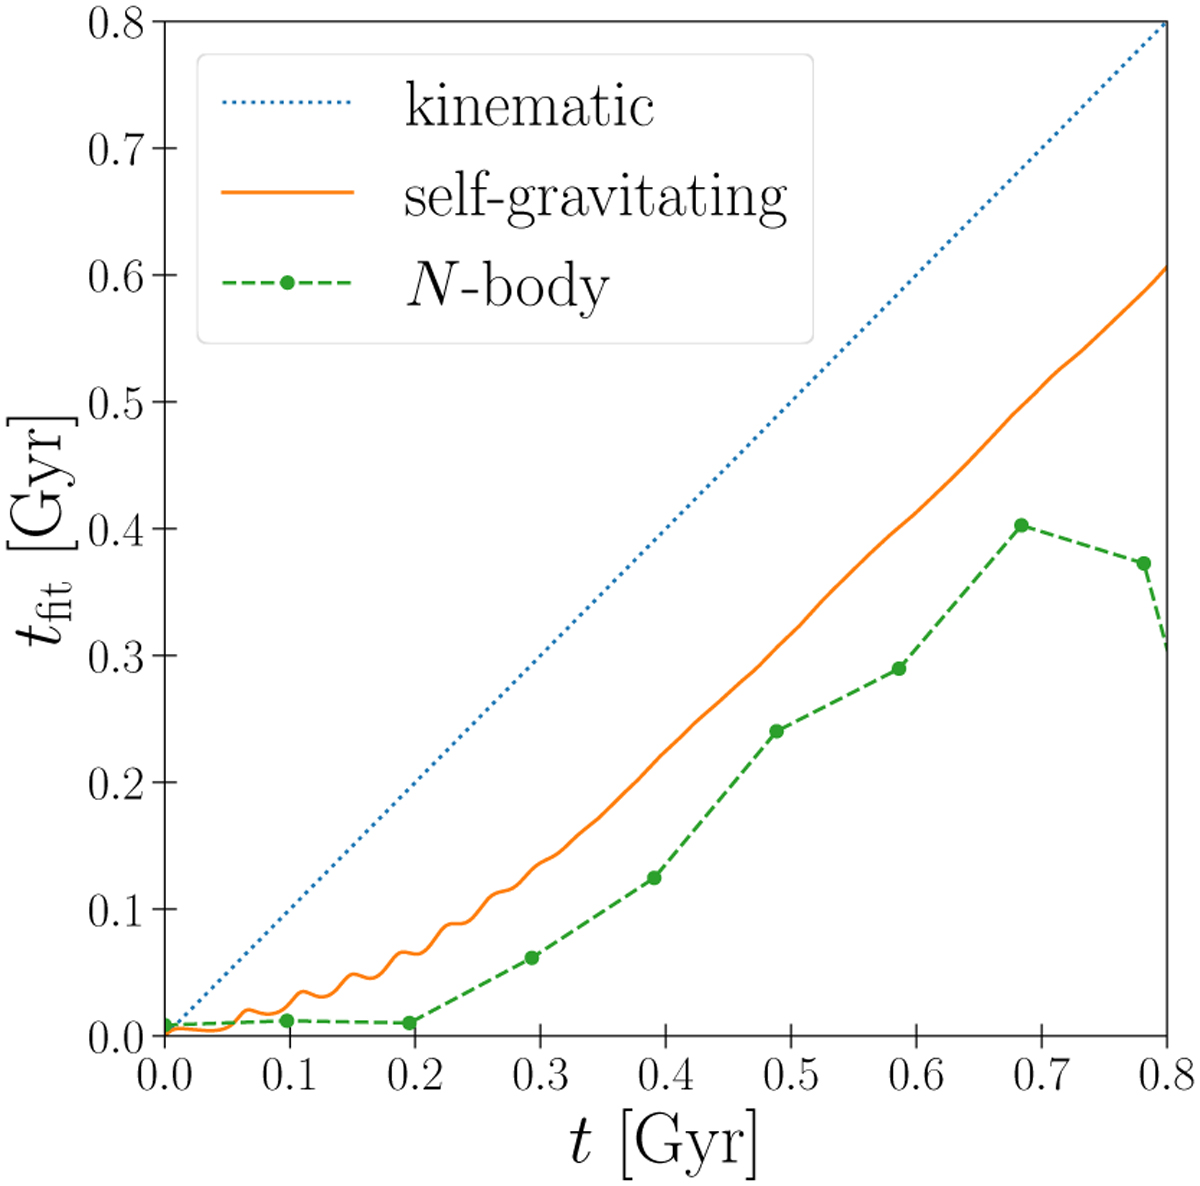
Comparison of the winding times of the phase spirals in the analytical model and the N-body model. The dotted blue and solid orange lines represent the values from the kinematic and self-gravitating models, respectively. The green dots connected with dashed lines represent the azimuthally averaged winding time ⟨tfit⟩ at the bin of Rg = 8–8.5 kpc in the N-body model. The drop in tfit at t ∼ 0.8 Gyr in the N-body model is caused by the second pericentric passage, which is not taken into account in the analytical model.
Current usage metrics show cumulative count of Article Views (full-text article views including HTML views, PDF and ePub downloads, according to the available data) and Abstracts Views on Vision4Press platform.
Data correspond to usage on the plateform after 2015. The current usage metrics is available 48-96 hours after online publication and is updated daily on week days.
Initial download of the metrics may take a while.