Fig. 5
Download original image
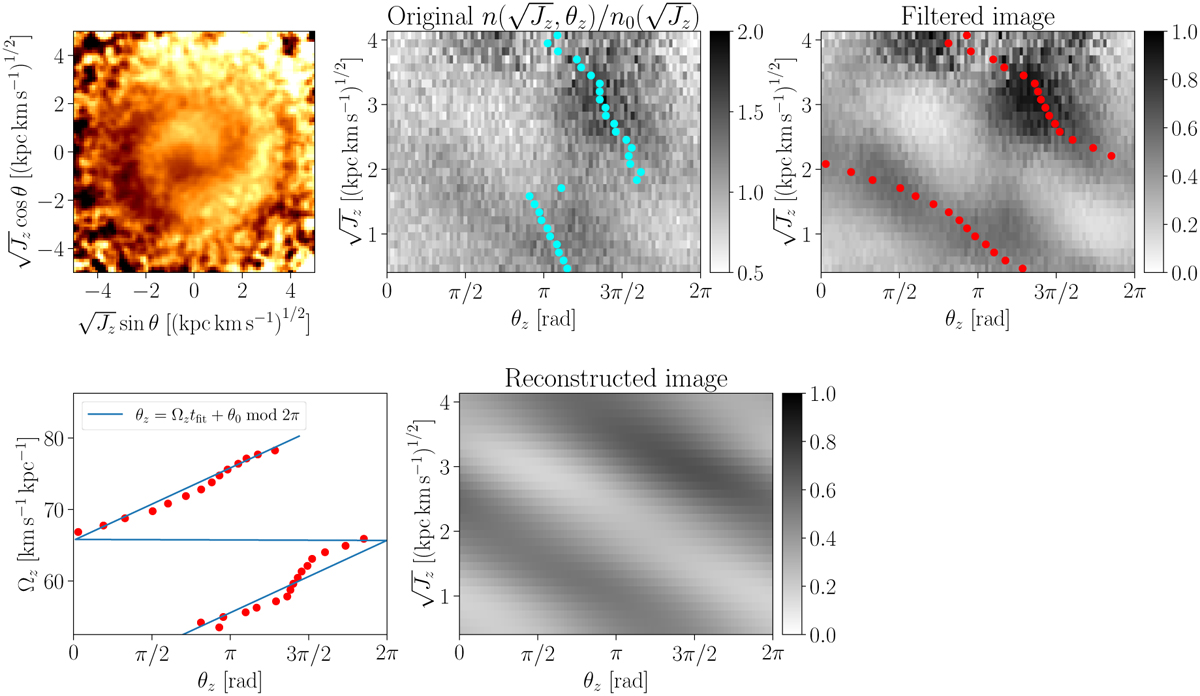
Phase spiral unwinding. Top left: density contrast in the ![]() space. Top middle: same data mapped into the
space. Top middle: same data mapped into the ![]() space. The cyan dots indicate the phase of the k = 1 Fourier mode. Top right: Filtered
space. The cyan dots indicate the phase of the k = 1 Fourier mode. Top right: Filtered ![]() map. The red dots indicate the phase of the k = 1 Fourier mode for the filtered map. Bottom left: phase of the k = 1 Fourier mode mapped into the Ωz–θz space, where Ωz is the vertical frequency. The blue line shows the best-fit linear model. Bottom right:
map. The red dots indicate the phase of the k = 1 Fourier mode for the filtered map. Bottom left: phase of the k = 1 Fourier mode mapped into the Ωz–θz space, where Ωz is the vertical frequency. The blue line shows the best-fit linear model. Bottom right: ![]() map reconstructed from the fitting result.
map reconstructed from the fitting result.
Current usage metrics show cumulative count of Article Views (full-text article views including HTML views, PDF and ePub downloads, according to the available data) and Abstracts Views on Vision4Press platform.
Data correspond to usage on the plateform after 2015. The current usage metrics is available 48-96 hours after online publication and is updated daily on week days.
Initial download of the metrics may take a while.