Fig. 8
Download original image
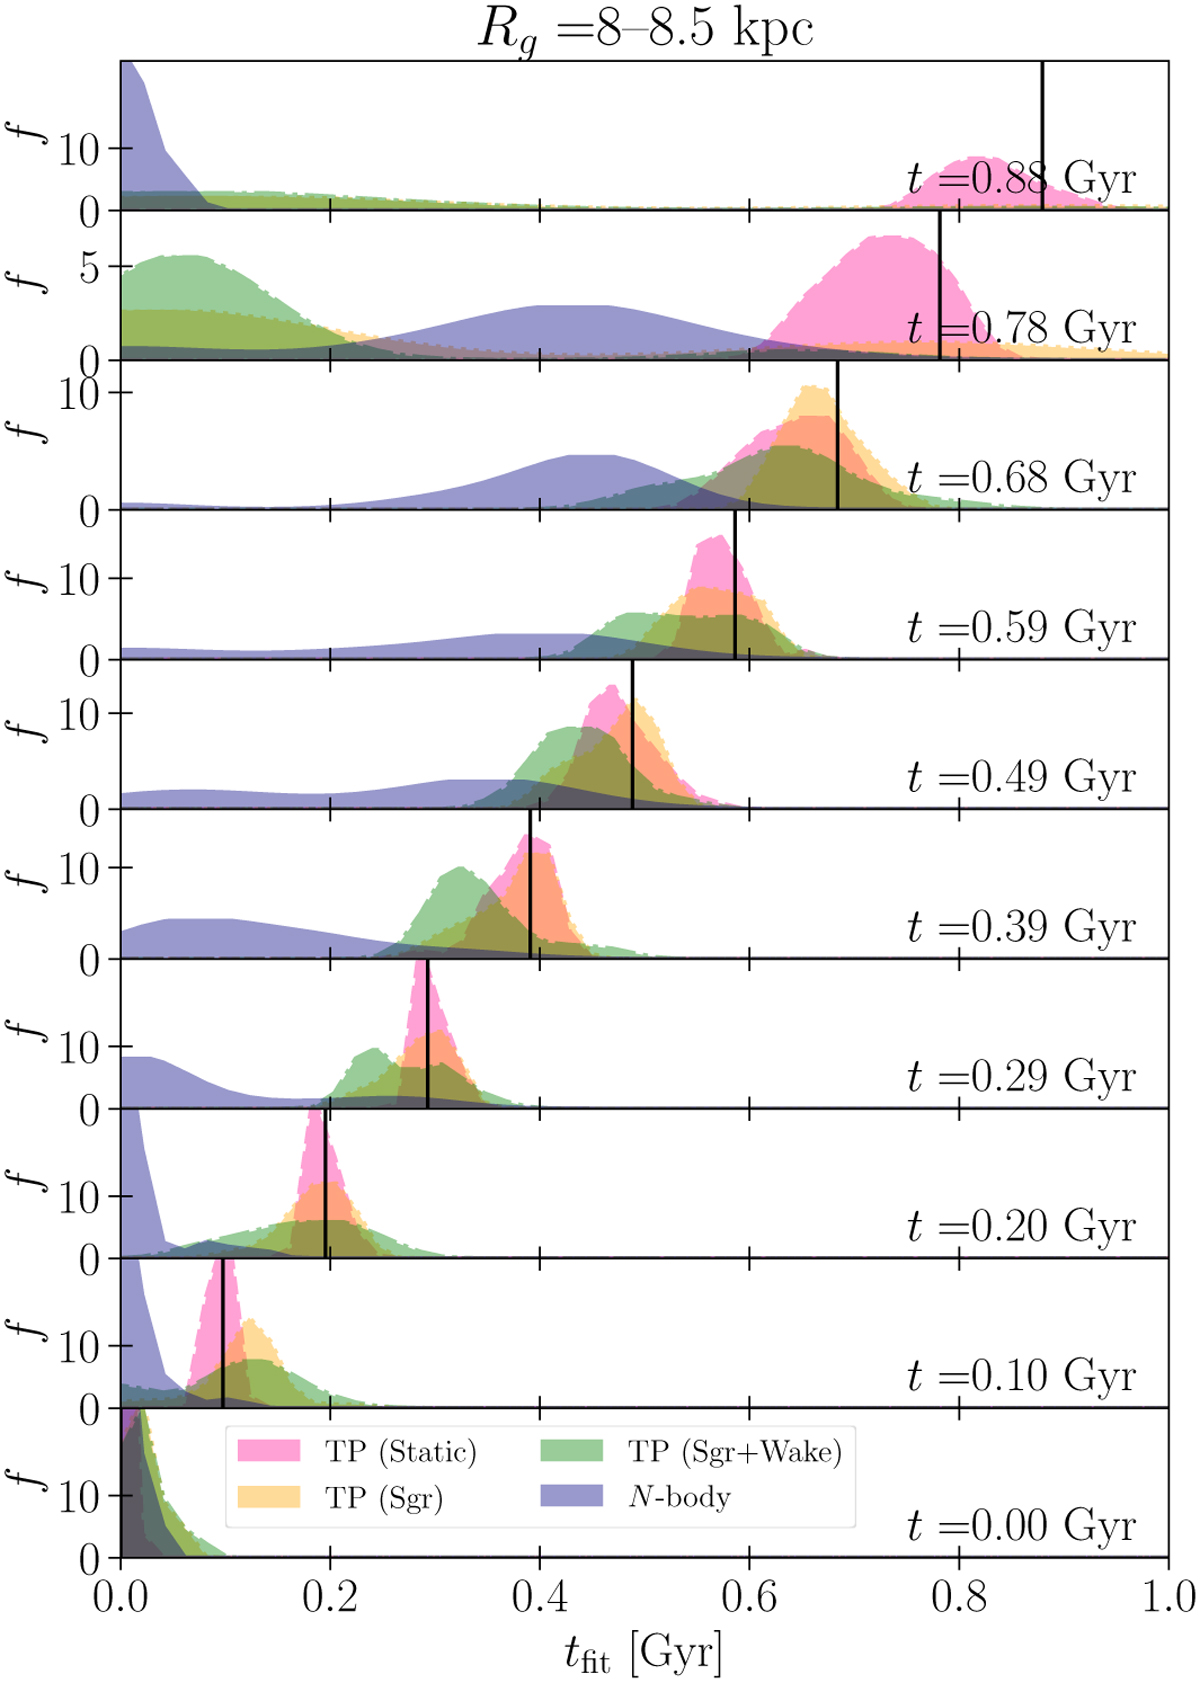
Distribution of the winding time tfit in the ring Rg = 8– 8.5 kpc. The filled pink, yellow, green, and purple areas represent KDE-smoothed distributions for the TP (static), TP (Sgr), TP (Sgr+wake), and N-body models, respectively. Each row corresponds to a different time, separated by ∼0.1 Gyr. The vertical lines indicate the actual time elapsed since the first pericentric passage.
Current usage metrics show cumulative count of Article Views (full-text article views including HTML views, PDF and ePub downloads, according to the available data) and Abstracts Views on Vision4Press platform.
Data correspond to usage on the plateform after 2015. The current usage metrics is available 48-96 hours after online publication and is updated daily on week days.
Initial download of the metrics may take a while.