Fig. 9
Download original image
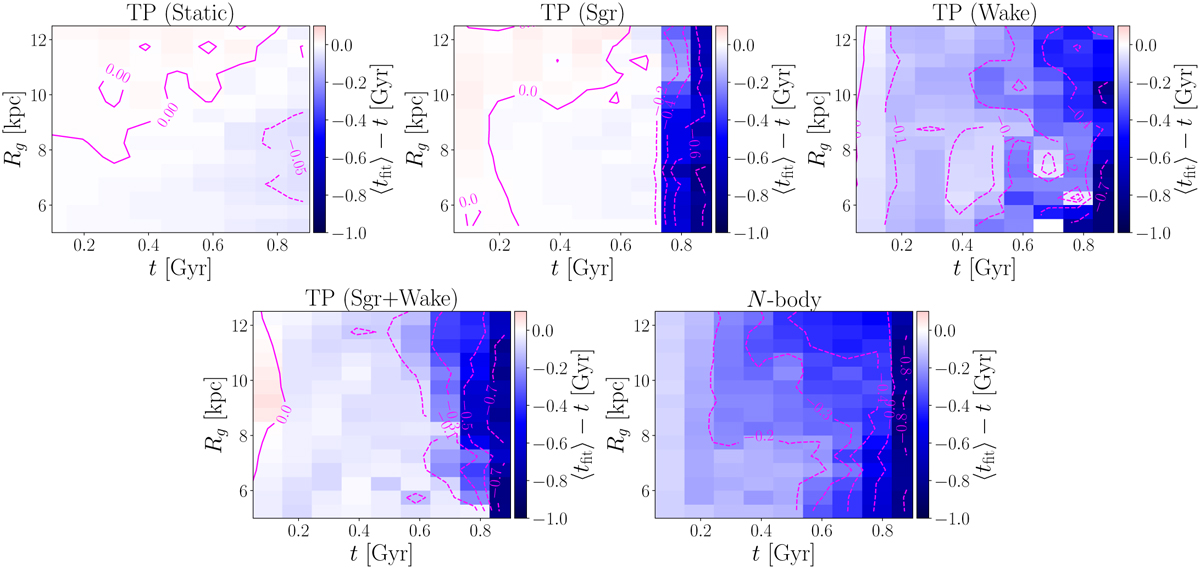
Mean winding time of the phase spiral as a function of Rg and t in the TP (static) (top left), TP (Sgr) (top middle), TP (wake) (top right), TP (Sgr+wake) (bottom left), and N-body (bottom right) models. The colours and contours indicate the mean winding time, ⟨tfit⟩, relative to the elapsed time since the first pericentric passage of Sgr.
Current usage metrics show cumulative count of Article Views (full-text article views including HTML views, PDF and ePub downloads, according to the available data) and Abstracts Views on Vision4Press platform.
Data correspond to usage on the plateform after 2015. The current usage metrics is available 48-96 hours after online publication and is updated daily on week days.
Initial download of the metrics may take a while.