Fig. 2.
Download original image
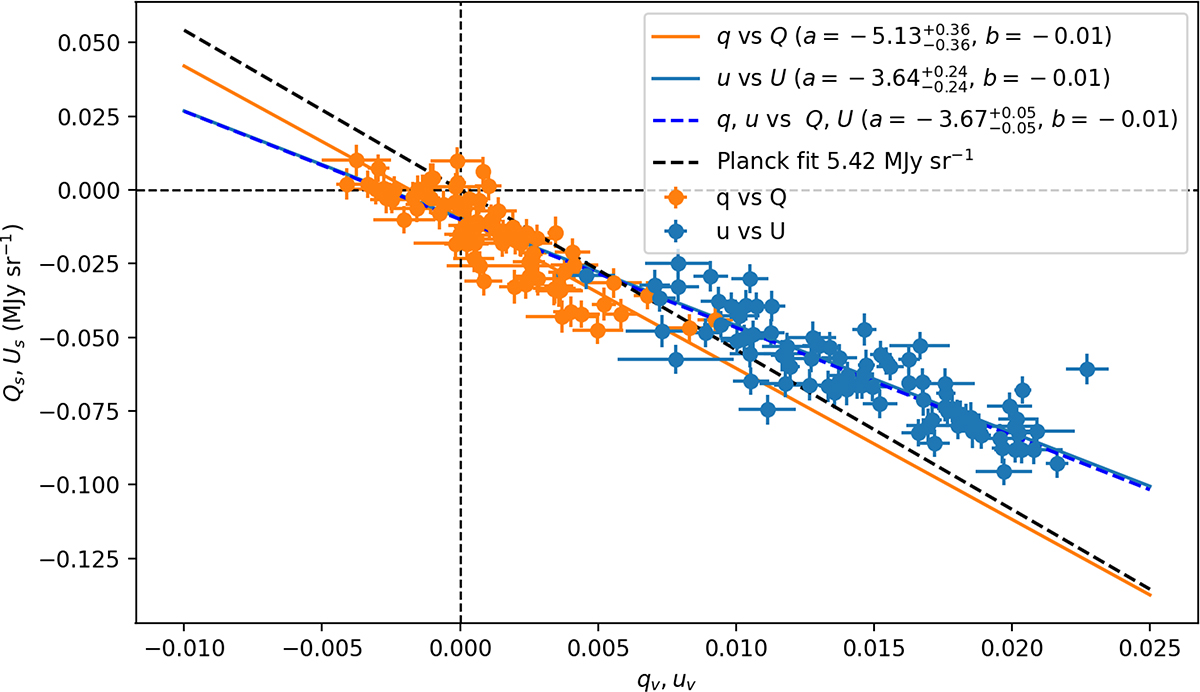
Correlation between the Stokes parameters from Planck (Qs, Us) and the fractional Stokes parameters from RoboPol (qv, uv). The blue points represent the correlation between Us and uv, while the orange points show the correlation between Qs and qv. The blue dashed line indicates the best-fit line of the joint correlation determined by minimizing χ2, while the solid blue and solid orange lines correspond to the Us − uv and Qs − qv fits, respectively. The black dashed line corresponds to the value from Planck Collaboration XII (2020).
Current usage metrics show cumulative count of Article Views (full-text article views including HTML views, PDF and ePub downloads, according to the available data) and Abstracts Views on Vision4Press platform.
Data correspond to usage on the plateform after 2015. The current usage metrics is available 48-96 hours after online publication and is updated daily on week days.
Initial download of the metrics may take a while.