Open Access
Fig. 3.
Download original image
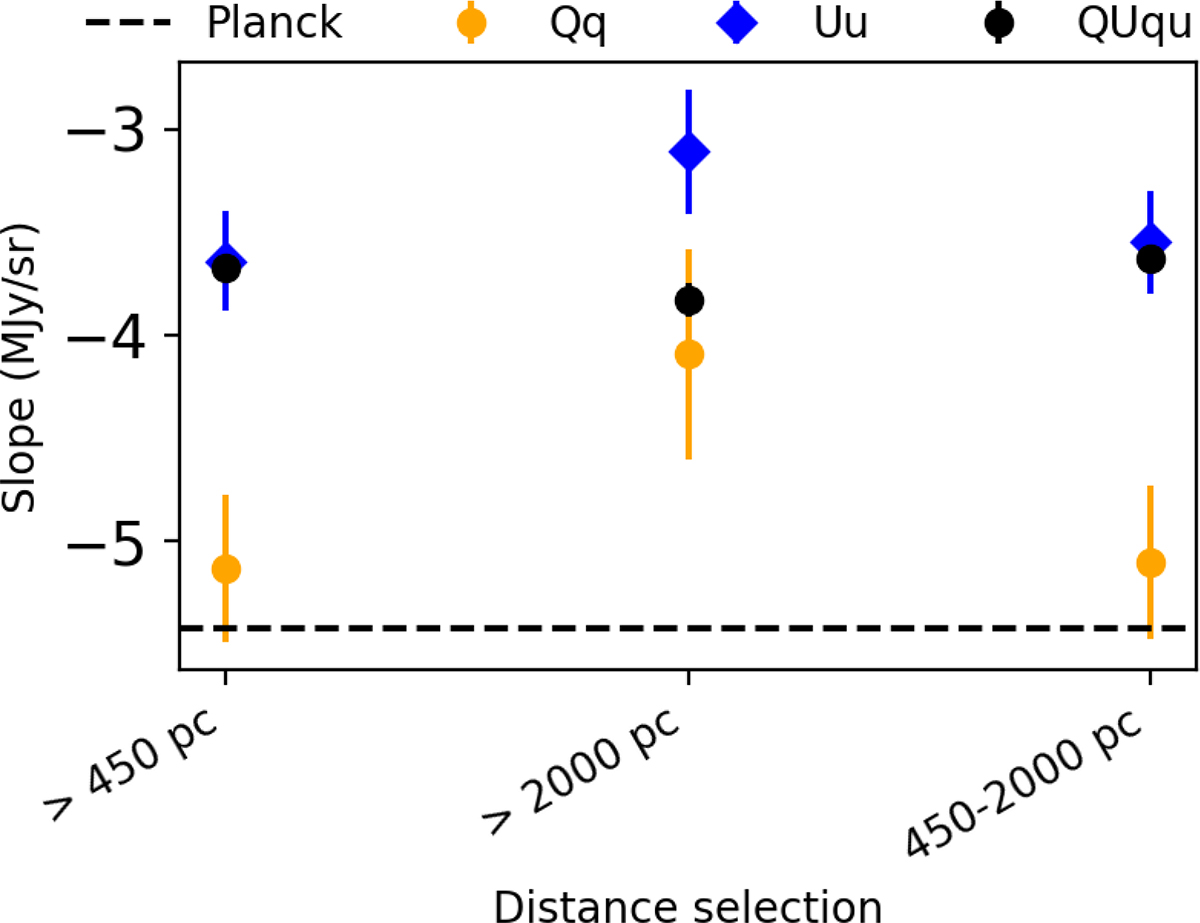
Comparison of best-fit slope values for different star sample selections. All cases are analyzed at the same Nside of 256. The slope found in Planck Collaboration XII (2020) is shown as the black dashed line.
Current usage metrics show cumulative count of Article Views (full-text article views including HTML views, PDF and ePub downloads, according to the available data) and Abstracts Views on Vision4Press platform.
Data correspond to usage on the plateform after 2015. The current usage metrics is available 48-96 hours after online publication and is updated daily on week days.
Initial download of the metrics may take a while.