Fig. 5.
Download original image
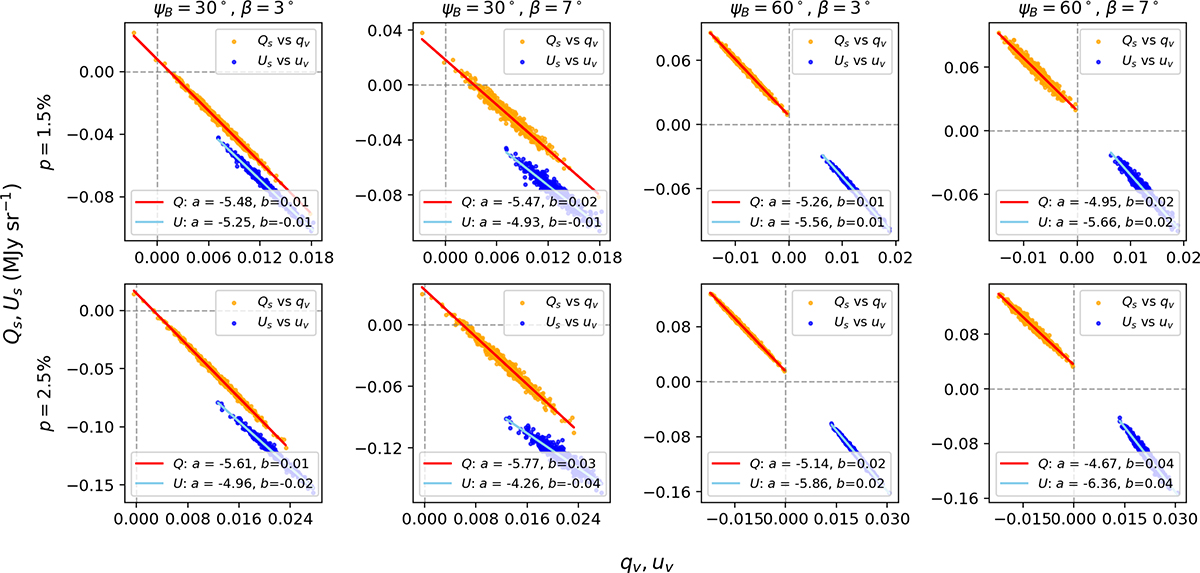
Correlation plots and linear fits between (Qs, qv) and (Us, uv) for two values of the polarization degree, p = 1.5% (top row) and p = 2.5% (bottom row). Each column corresponds to a combination of magnetic field orientation ΨB⊥ = {30°, 60°} and miscalibration offset β = {3°, 7°}, increasing from left to right. The best-fit values for the slopes (absolute value) and for the intercept obtained for the correlations are given in the legend; the resulting model is shown on the scatter plot, in blue for (Qs, qv) and in orange for (Us, uv). They are expressed in MJy sr−1. To generate the data, we used Rp/p = 5.42 MJy sr−1, σΨB⊥ = 5°, and σp = 0.2% to produce the dynamical range.
Current usage metrics show cumulative count of Article Views (full-text article views including HTML views, PDF and ePub downloads, according to the available data) and Abstracts Views on Vision4Press platform.
Data correspond to usage on the plateform after 2015. The current usage metrics is available 48-96 hours after online publication and is updated daily on week days.
Initial download of the metrics may take a while.