Fig. B.1.
Download original image
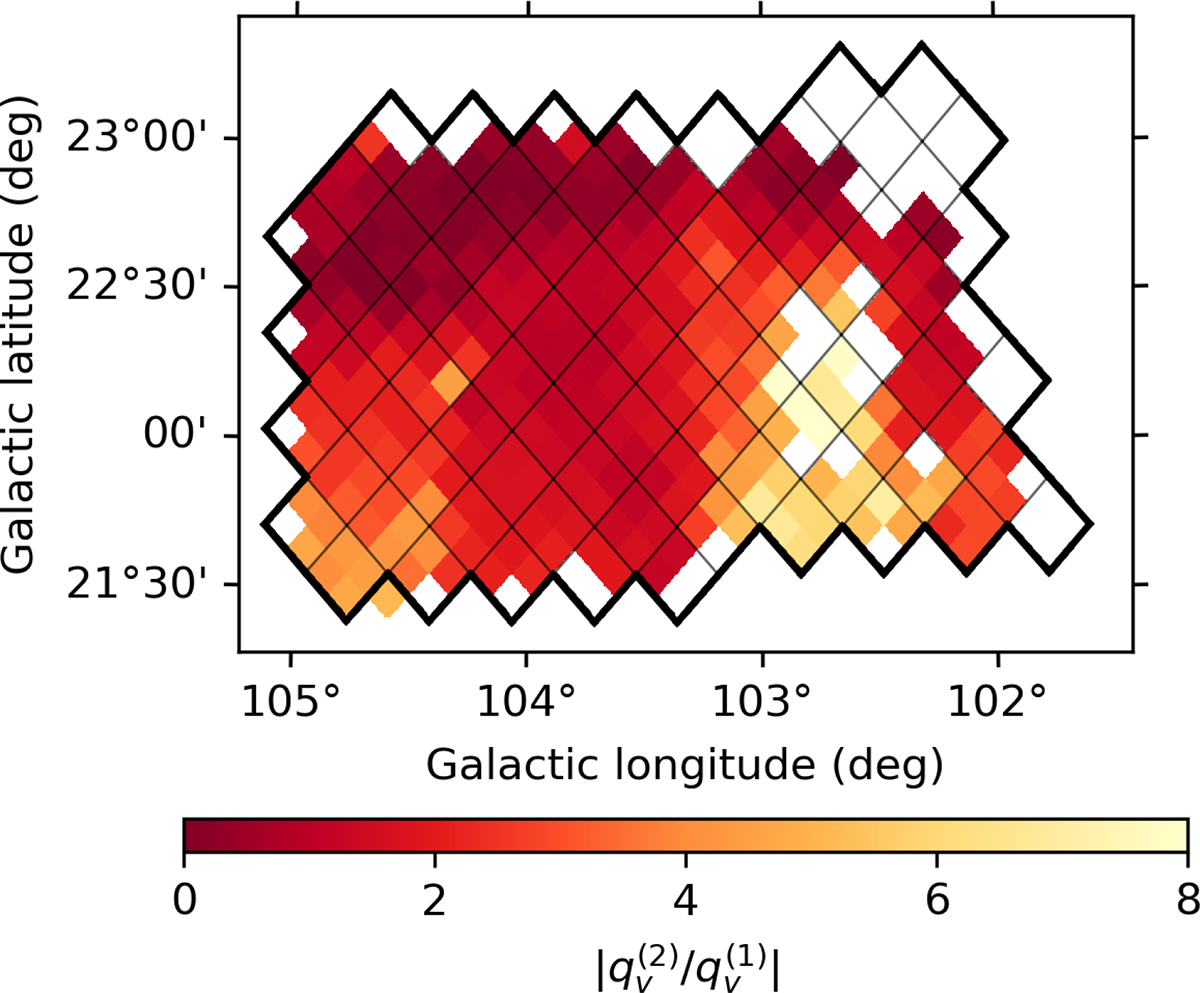
Map of ![]() at Nside = 512. The black contour traces the Nside = 256 footprint used in Fig.1, and the thin lines mark the pixel boundaries. The white pixels at the outskirts of the region indicate areas with no decomposition information, while the white pixels within the footprint indicate locations where there is no evidence of the nearby cloud.
at Nside = 512. The black contour traces the Nside = 256 footprint used in Fig.1, and the thin lines mark the pixel boundaries. The white pixels at the outskirts of the region indicate areas with no decomposition information, while the white pixels within the footprint indicate locations where there is no evidence of the nearby cloud.
Current usage metrics show cumulative count of Article Views (full-text article views including HTML views, PDF and ePub downloads, according to the available data) and Abstracts Views on Vision4Press platform.
Data correspond to usage on the plateform after 2015. The current usage metrics is available 48-96 hours after online publication and is updated daily on week days.
Initial download of the metrics may take a while.