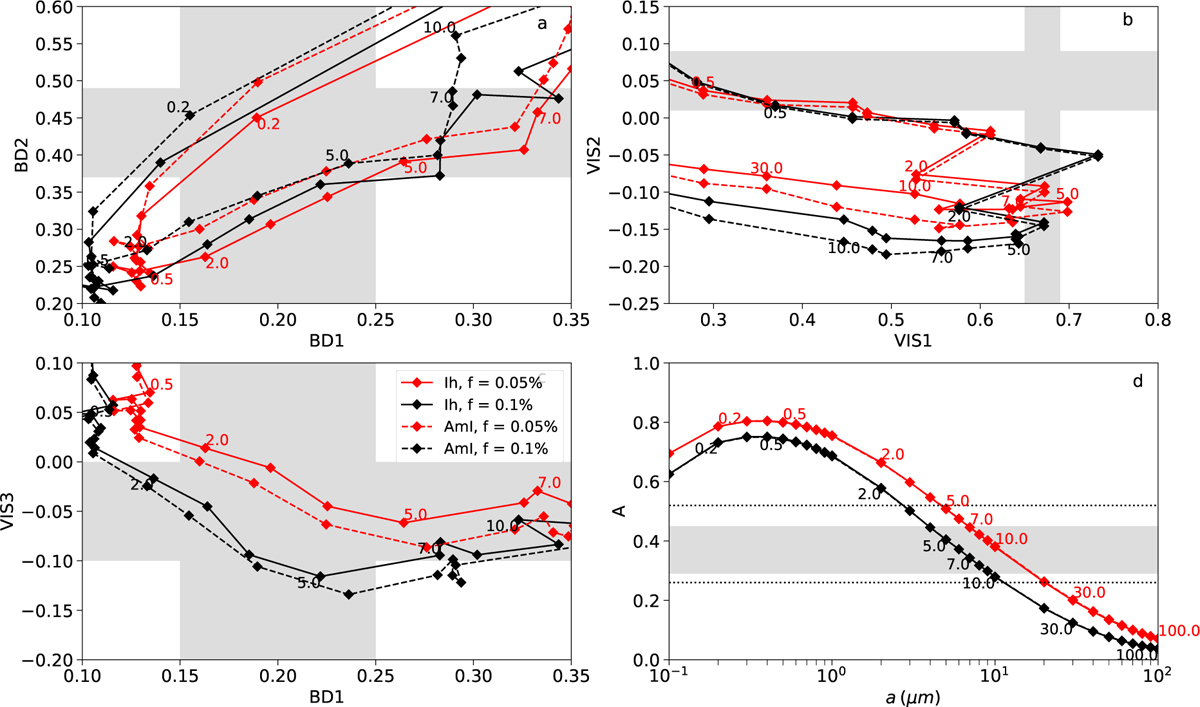
Fig. 2
Download original image
Spectral indicators: VNIR constraints and modelled ones. Constraints from VNIR observations as given in Table 1 correspond to the shaded zones. Modelled indicators are plotted as a function of grain size a, which is composed of an intra-molecular mixture of water ice, either crystalline hexagonal (Ih, solid line) or amorphous (AmI, dashed line), with AmC and Th, with a fraction of f = 0.05% (red) or 0.1% (black). The size is regularly indicated (in μm) along the curves: (a) BD2 versus BD1; (b) VIS2 versus VIS1; (c) VIS3 versus BD1; (d) A versus a. Bolometric Bond albedo constraints inferred from IR observations by Howett et al. (2014) are also plotted (dotted line).
Current usage metrics show cumulative count of Article Views (full-text article views including HTML views, PDF and ePub downloads, according to the available data) and Abstracts Views on Vision4Press platform.
Data correspond to usage on the plateform after 2015. The current usage metrics is available 48-96 hours after online publication and is updated daily on week days.
Initial download of the metrics may take a while.