Fig. 3
Download original image
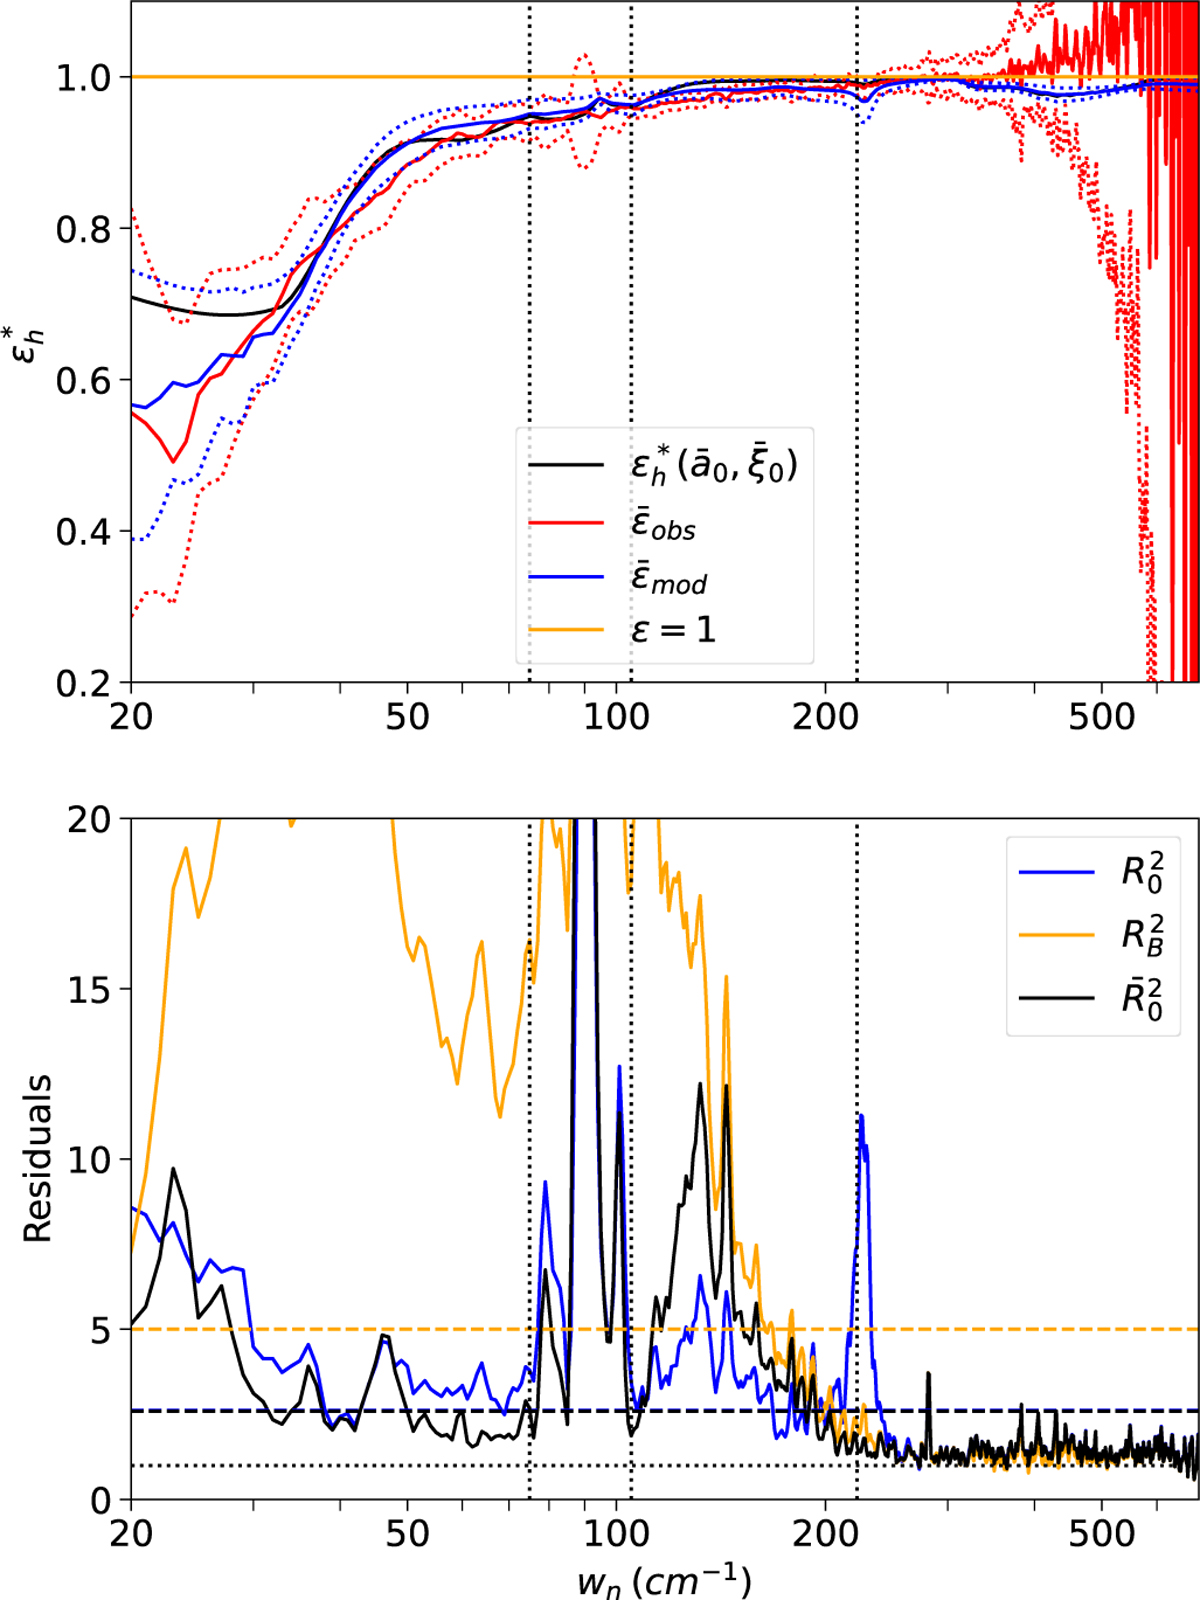
Observed and best mean hemispherical emissivities. Top: hemispherical emissivities as a function of wave number for observation #1: mean observed (Eq. (9), red), mean of best models (Eq. (10)) and their standard deviations (dotted lines), and best model across all spectra (black) obtained with model Mo. Bottom: spectral residuals R2(wn) (Eq. (7)) and ![]() (wn) (Eq. (8)) obtained with blackbody model (
(wn) (Eq. (8)) obtained with blackbody model (![]() ) or smooth model, Mo(
) or smooth model, Mo(![]() or
or ![]() ). Mean and mean-global residuals are plotted as dashed lines. The intra-molecular mixture is AmC and Th at 0.1%, each within a matrix of Ih crystalline ice. The lattice vibration at 222 cm−1 and instrumental fluctuation about 90 cm−1 are indicated (vertical dotted lines).
). Mean and mean-global residuals are plotted as dashed lines. The intra-molecular mixture is AmC and Th at 0.1%, each within a matrix of Ih crystalline ice. The lattice vibration at 222 cm−1 and instrumental fluctuation about 90 cm−1 are indicated (vertical dotted lines).
Current usage metrics show cumulative count of Article Views (full-text article views including HTML views, PDF and ePub downloads, according to the available data) and Abstracts Views on Vision4Press platform.
Data correspond to usage on the plateform after 2015. The current usage metrics is available 48-96 hours after online publication and is updated daily on week days.
Initial download of the metrics may take a while.