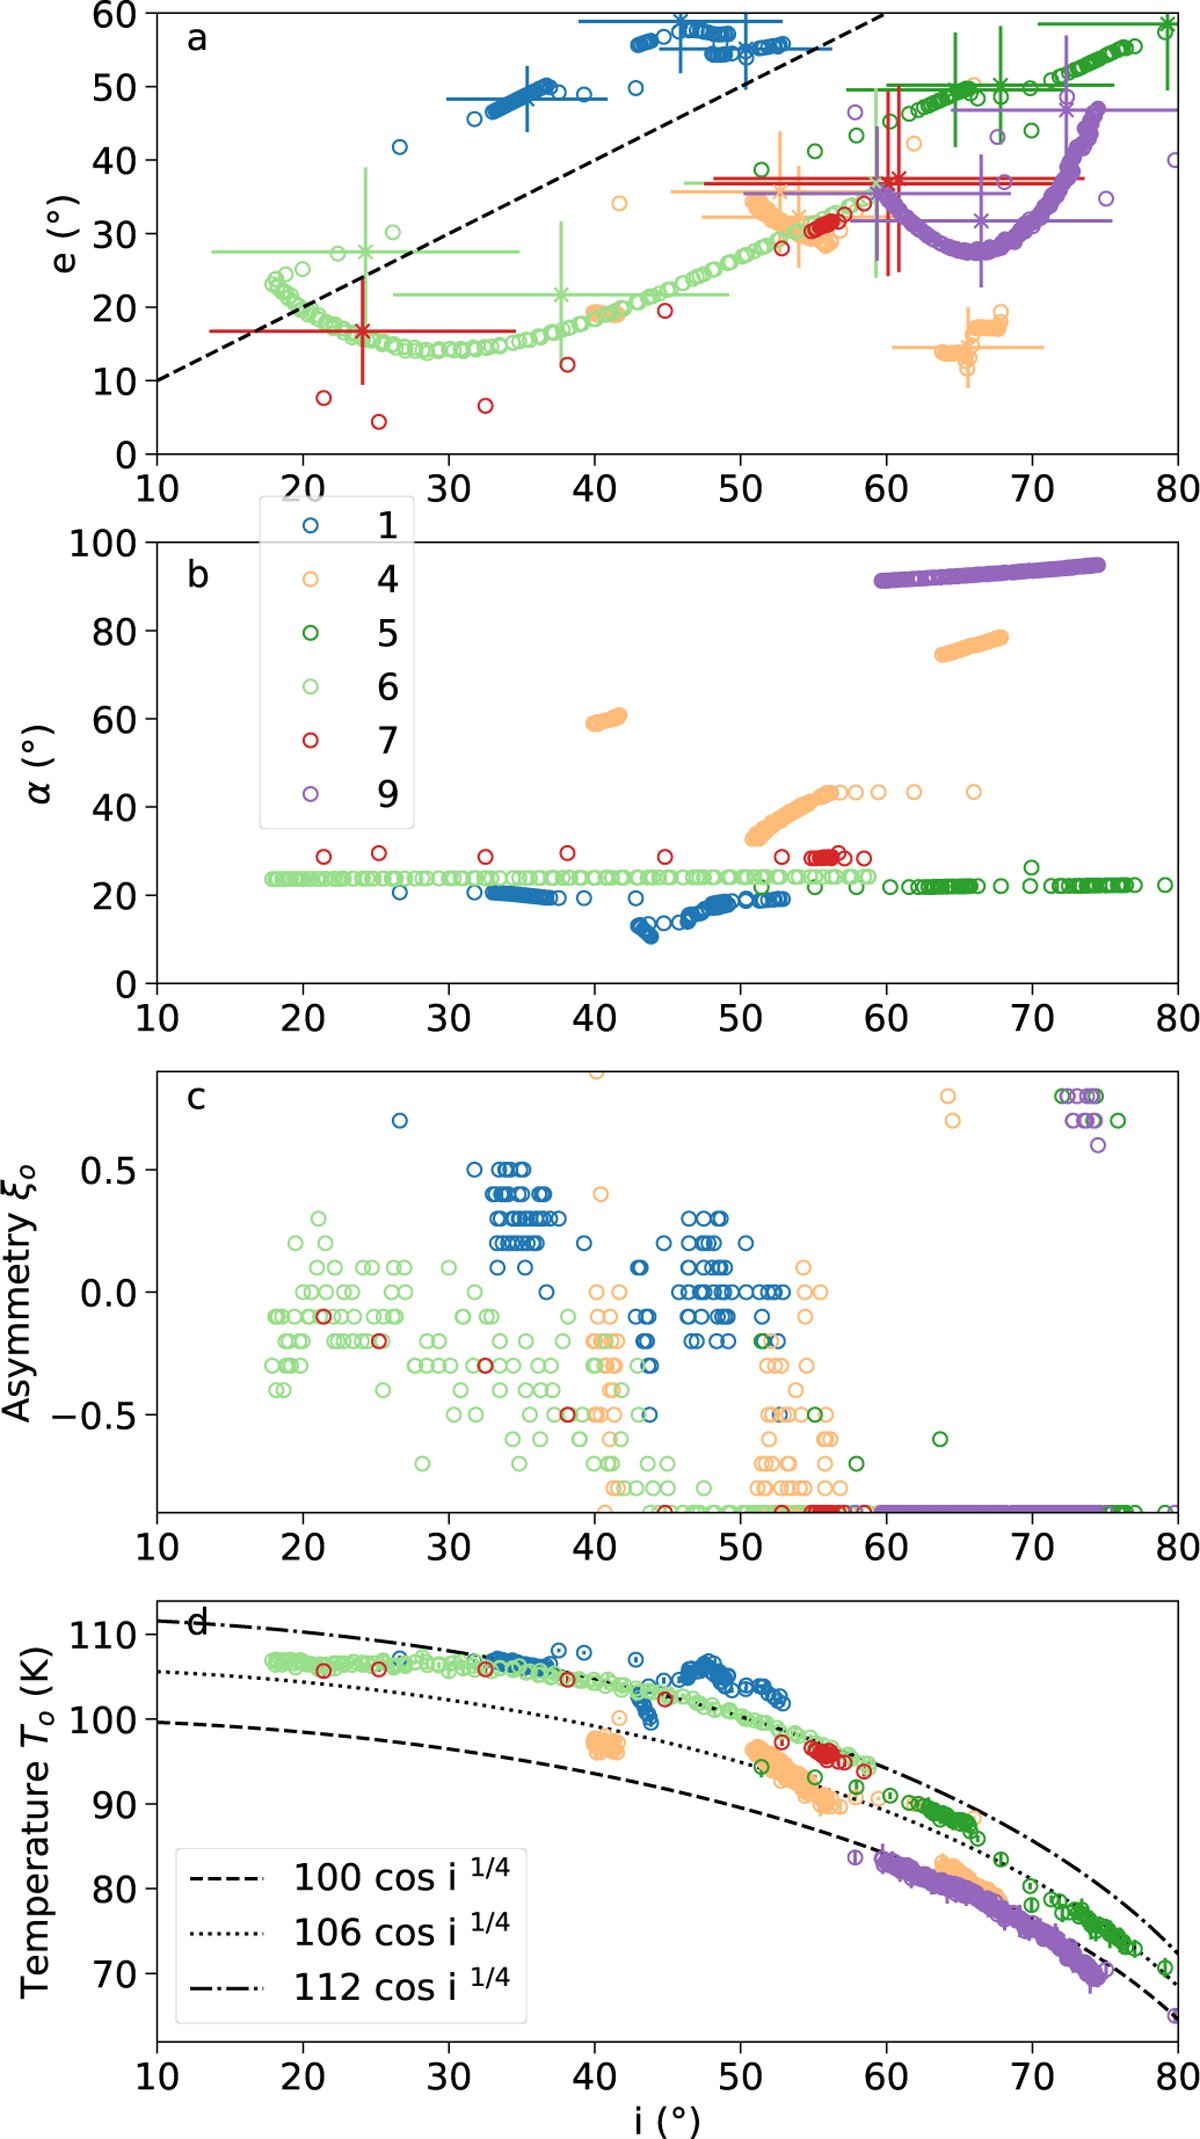
Fig. 4
Download original image
Results with smooth surface model, Mo. (a) Emission, e, versus incidence, i, angles of all pointings for daytime observations as numbered in Table 2. These angles are relative to the normal of the reference ellipsoid at the centre of the FOV. Mean (x symbol) and standard deviation (error bars) of local incidence and emission angles on tiles within footprints at the start, middle, and end of observations are also plotted. (b) Phase angle, α, of pointings versus i. (c) Asymmetry factor, ξo, versus i inferred for each pointing, j. (d) Temperatures of To versus i inferred for each pointing j. Temperature dependences with i such as Tm cos(i)1/4 are plotted for Tm = 98, 106, and 112 K. Error bars on To are plotted and are very small. The intra-molecular mixture of amorphous water ice with 0.1% Th and AmC is assumed.
Current usage metrics show cumulative count of Article Views (full-text article views including HTML views, PDF and ePub downloads, according to the available data) and Abstracts Views on Vision4Press platform.
Data correspond to usage on the plateform after 2015. The current usage metrics is available 48-96 hours after online publication and is updated daily on week days.
Initial download of the metrics may take a while.