Fig. 7
Download original image
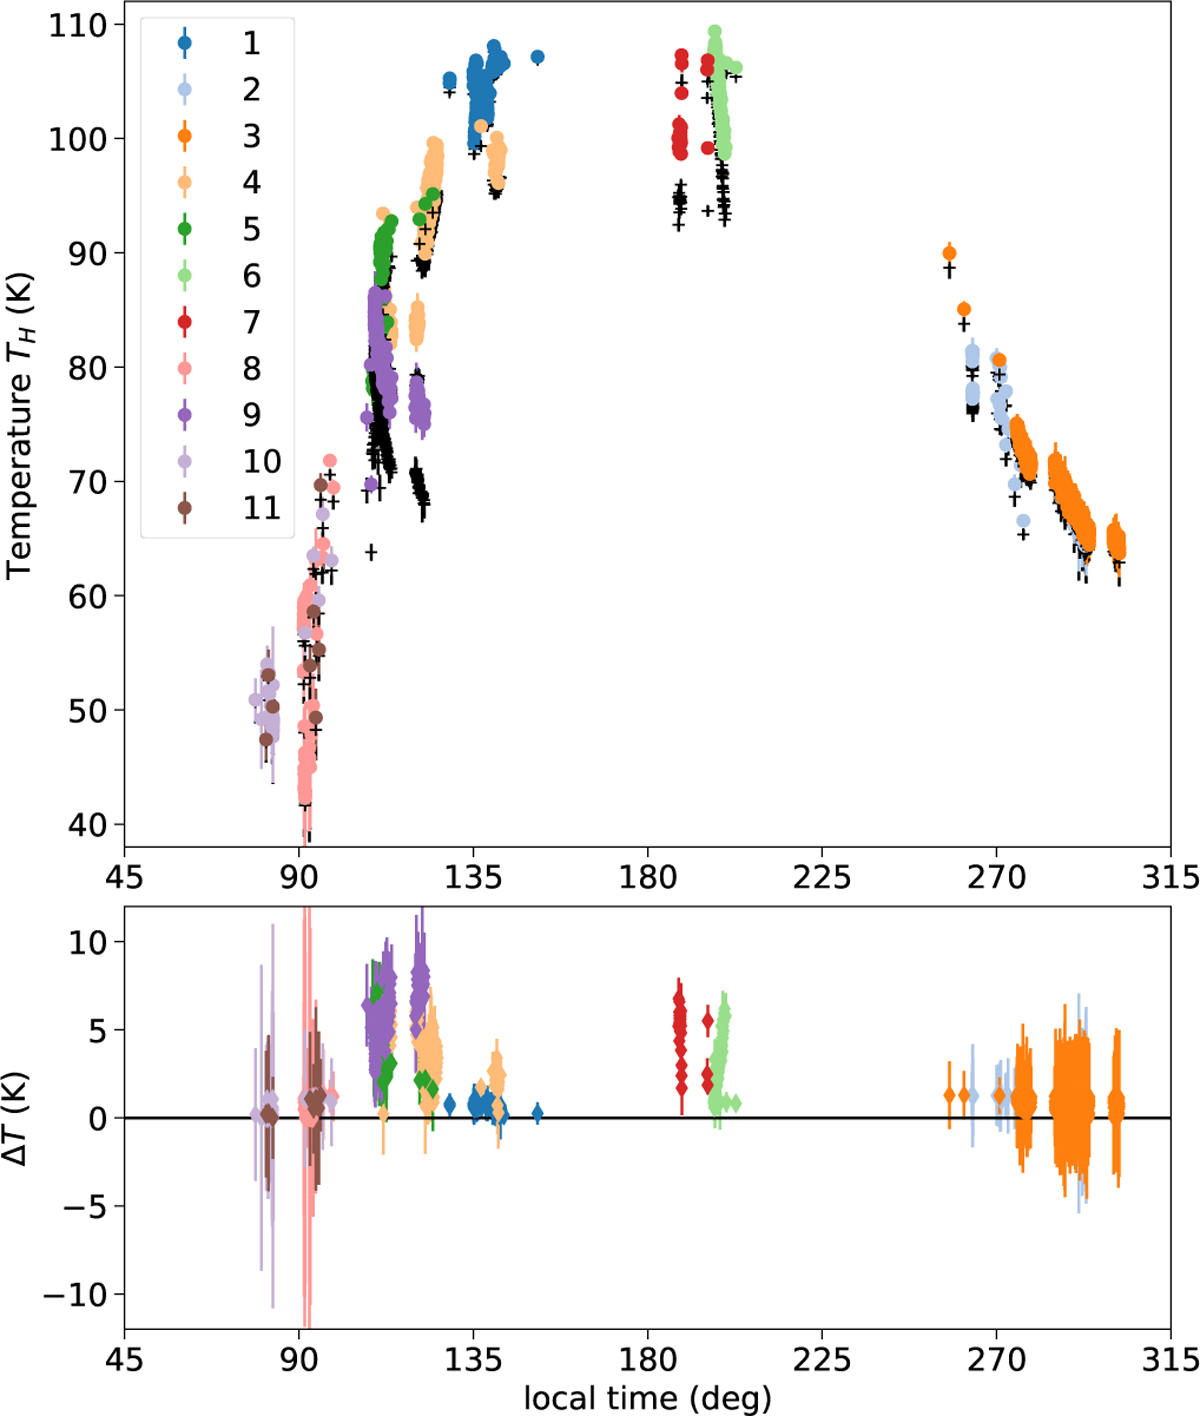
Surface temperatures versus local time. Top: temperatures, TH, for each pointing of observations listed in Table 2, inferred with the model MH for daytime ones or with Mo for the ones left over (Table 4). The blackbody temperatures, TB, estimated for the same spectra are plotted in black (+). Error bars on these estimates are about 1 or 2 K for dawn and dusk observations, and they decrease to 0.3 K at noon. Bottom: deviation ΔT = TH − TB for each pointing and their error bars. Local time is 0° at midnight and 180° at noon.
Current usage metrics show cumulative count of Article Views (full-text article views including HTML views, PDF and ePub downloads, according to the available data) and Abstracts Views on Vision4Press platform.
Data correspond to usage on the plateform after 2015. The current usage metrics is available 48-96 hours after online publication and is updated daily on week days.
Initial download of the metrics may take a while.