Fig. 1.
Download original image
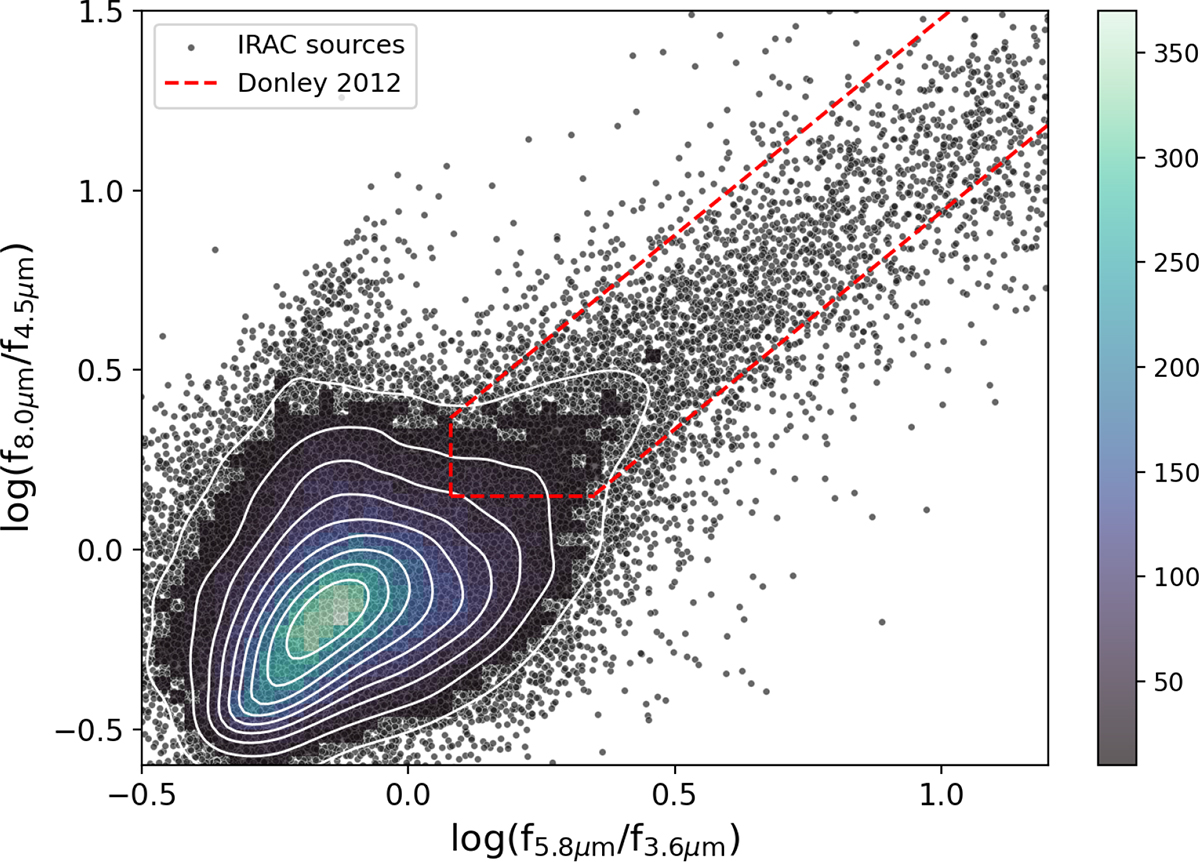
IRAC color–color diagram of the MIR sources. The small gray dots represent all IRAC sources selected in the COSMOS. The region bounded by dashed red lines marks the MIR-AGN selection region of Donley et al. (2012). The sources within this region are classified as MIR-selected AGNs. The color bar and overlaid contours trace the number density gradient across the diagram.
Current usage metrics show cumulative count of Article Views (full-text article views including HTML views, PDF and ePub downloads, according to the available data) and Abstracts Views on Vision4Press platform.
Data correspond to usage on the plateform after 2015. The current usage metrics is available 48-96 hours after online publication and is updated daily on week days.
Initial download of the metrics may take a while.