Fig. 3.
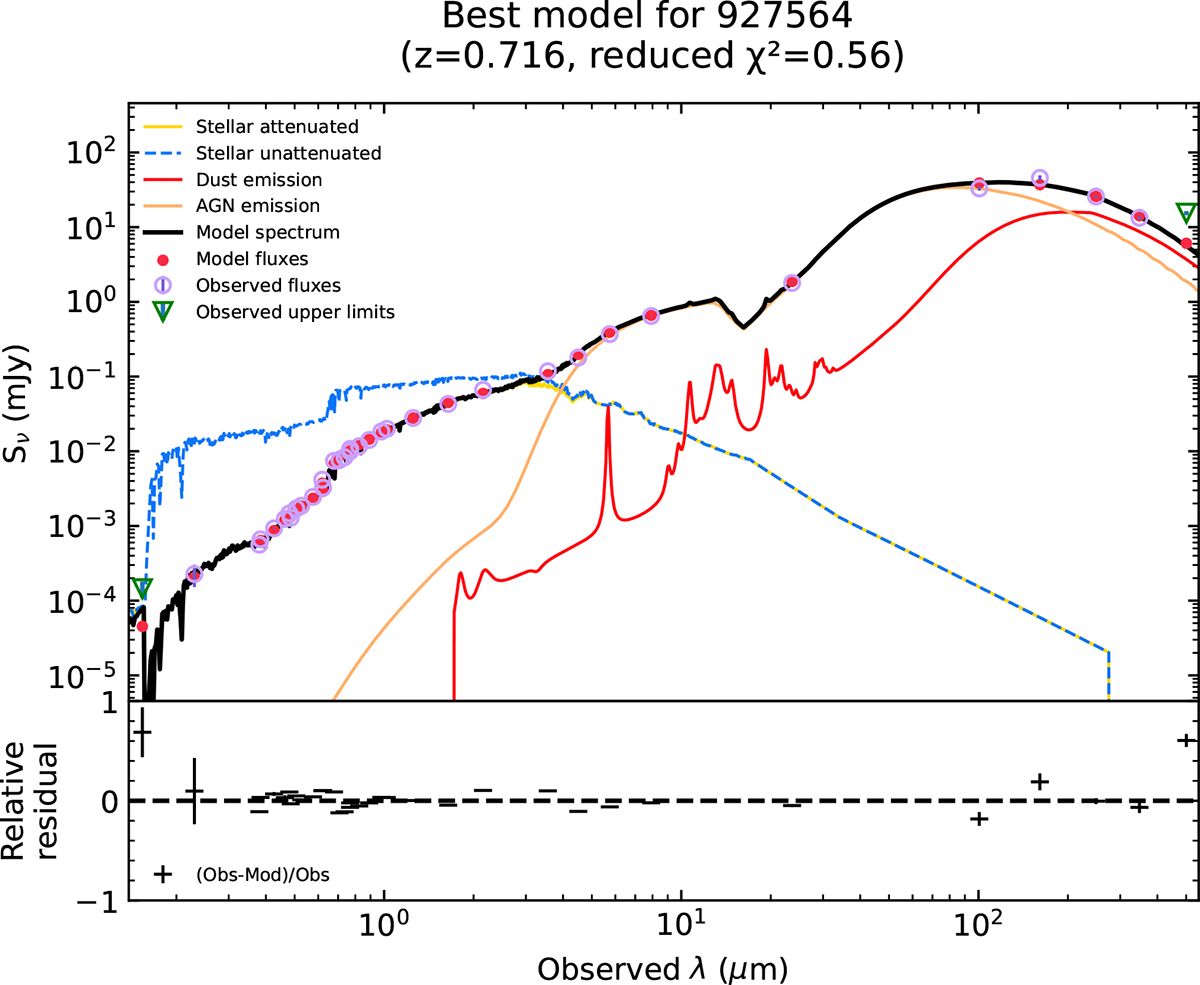
Download original image
Example of the best-fitting SED for an AGN. The solid black line indicates the best-fitting model. The dashed blue, solid gold, and solid red lines represent unattenuated stellar, attenuated stellar, and dust emission, respectively. The solid apricot line indicates AGN emission. The strawberry filled circles, pastel-purple open circles, and green open inverted triangles denote model predictions, observed fluxes, and observed upper limits, respectively. The lower panel indicates the residual of the best fitting.
Current usage metrics show cumulative count of Article Views (full-text article views including HTML views, PDF and ePub downloads, according to the available data) and Abstracts Views on Vision4Press platform.
Data correspond to usage on the plateform after 2015. The current usage metrics is available 48-96 hours after online publication and is updated daily on week days.
Initial download of the metrics may take a while.