Fig. 5.
Download original image
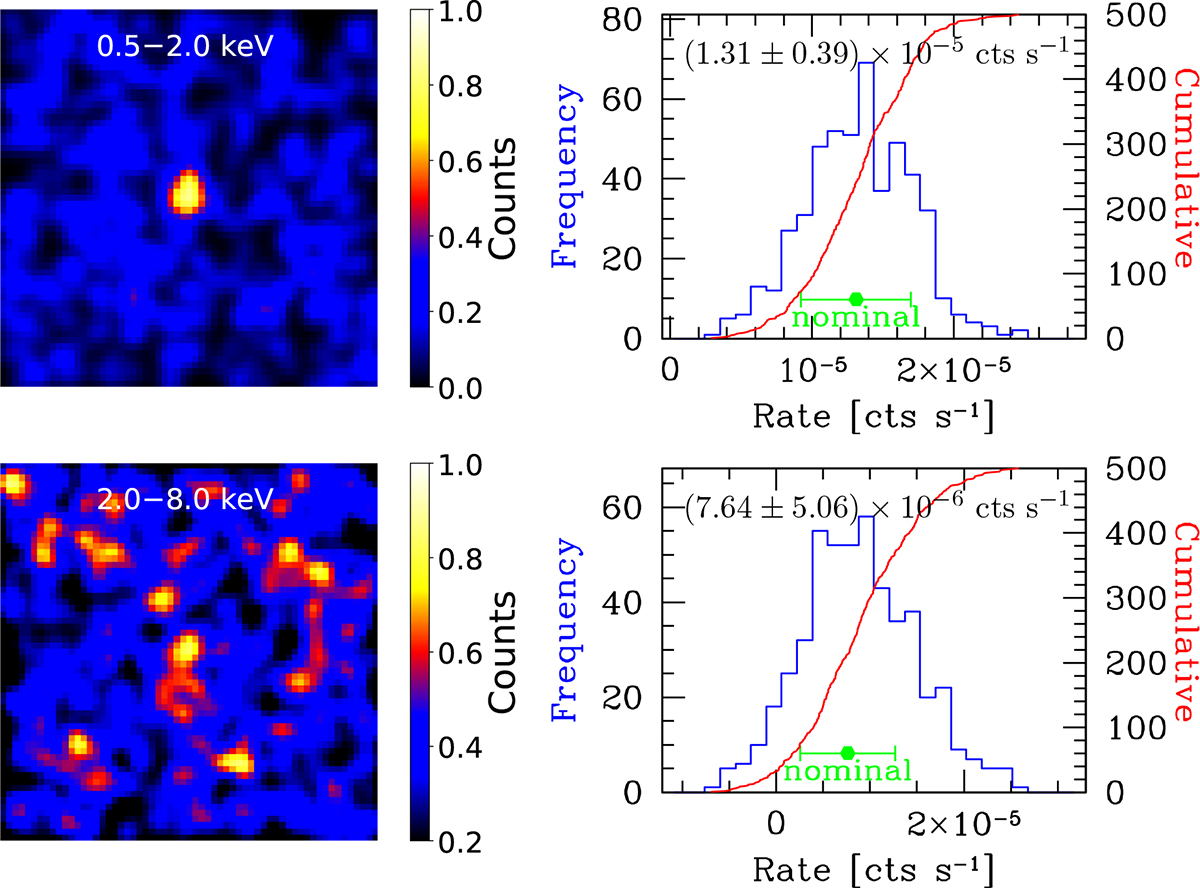
X-ray stacking results for the 23 CT-AGNs identified by MIR diagnostics. Left: Stacked images in the 0.5–2 keV (top) and 2–8 keV (bottom) bands. Right: Corresponding bootstrap histograms of the net count rates. Green lines indicate the mean count rates and 1σ confidence intervals. Detections exceed 3σ significance in the soft band, while only exceeding a 1σ significance in the hard band.
Current usage metrics show cumulative count of Article Views (full-text article views including HTML views, PDF and ePub downloads, according to the available data) and Abstracts Views on Vision4Press platform.
Data correspond to usage on the plateform after 2015. The current usage metrics is available 48-96 hours after online publication and is updated daily on week days.
Initial download of the metrics may take a while.