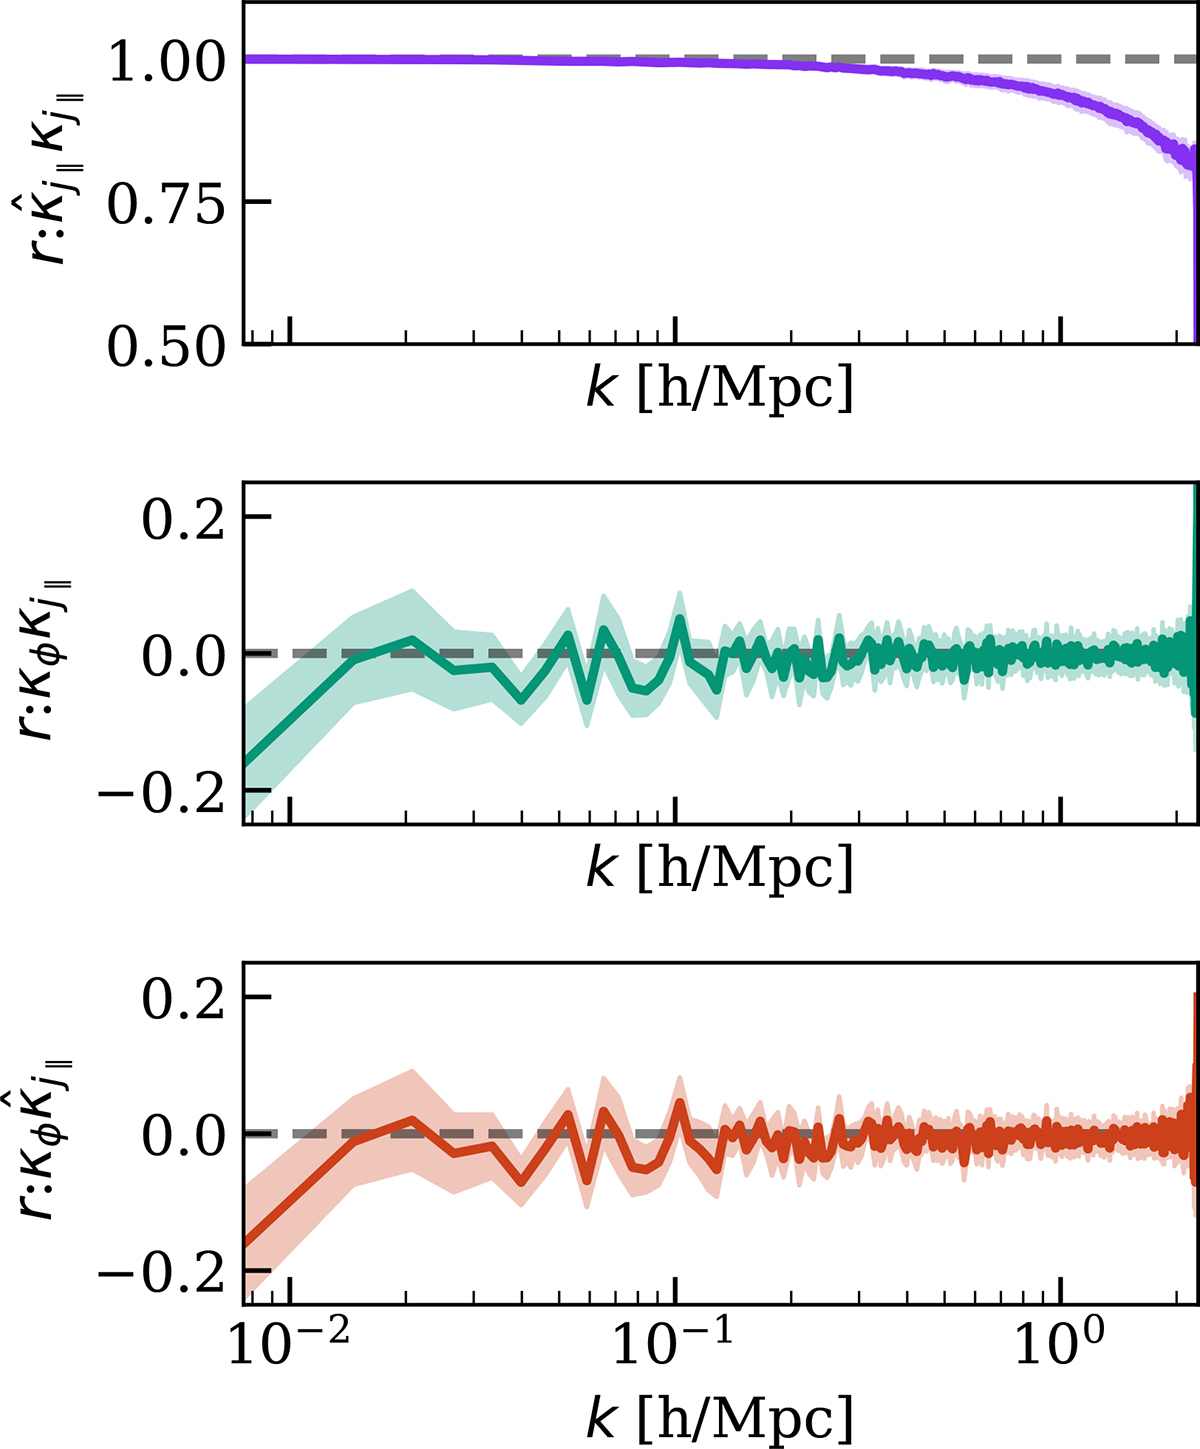
Fig. 3.
Download original image
Correlation coefficient r(k) between each of the projected fields. These tests are diagnostics to show that higher order correlations that we did not model do not introduce significant correlations between the density lensing and matter current lensing fields. The solid lines show the mean correlation coefficient from 15 different realisation of the fields (5 snapshots × 3 projection axes), the shaded regions show 1σ error bars calculated from the dispersion of the estimated correlation coefficients. Top: Correlation between the reconstructed momentum convergence, ![]() , and the momentum convergence, κj∥. Middle: Correlation between the momentum convergence, κj∥, and the density convergence, κϕ. Bottom: Correlation between the density convergence, κϕ, and the reconstructed momentum convergence,
, and the momentum convergence, κj∥. Middle: Correlation between the momentum convergence, κj∥, and the density convergence, κϕ. Bottom: Correlation between the density convergence, κϕ, and the reconstructed momentum convergence, ![]() .
.
Current usage metrics show cumulative count of Article Views (full-text article views including HTML views, PDF and ePub downloads, according to the available data) and Abstracts Views on Vision4Press platform.
Data correspond to usage on the plateform after 2015. The current usage metrics is available 48-96 hours after online publication and is updated daily on week days.
Initial download of the metrics may take a while.