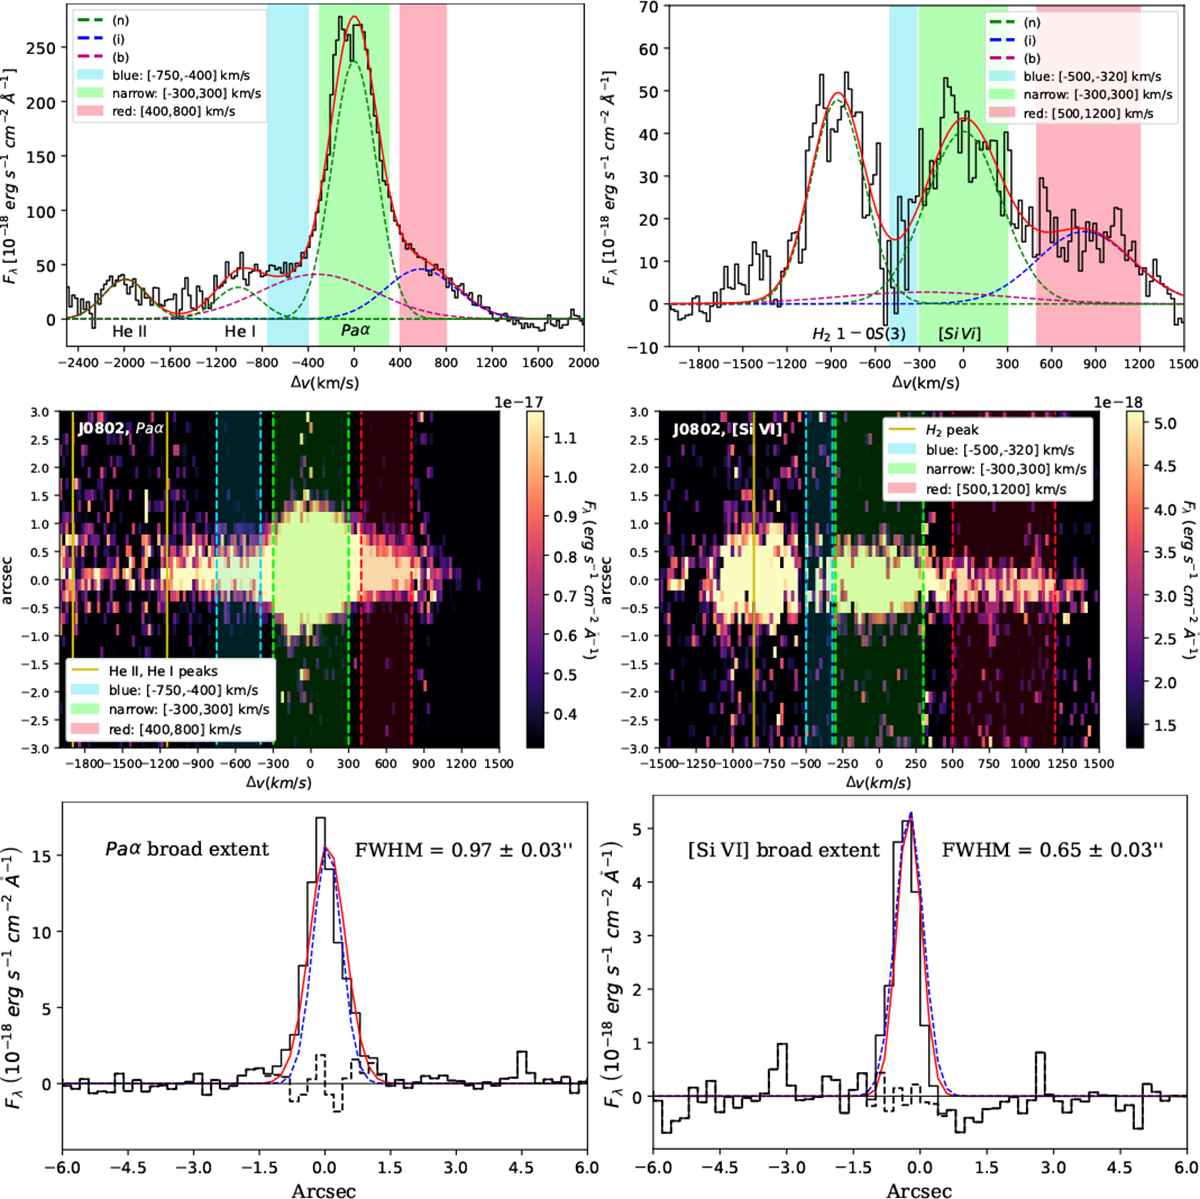
Fig. C.1.
Download original image
Spectral regions and spatial profiles used to calculate the outflow extent from Paα (left panels) and [Si VI] (right panels). Top row: Fits of the nuclear spectrum. The red and blue windows correspond to the wings of the lines, which are dominated by the outflows, while the green window captures the bulk of the narrow component. Middle row: Same spectral windows superimposed on the continuum-subtracted maps showing the line emission along the spectral and spatial directions. Bottom row: Average (i.e., weighted mean of the red and blue wings) continuum-subtracted spatial profiles of the Paα and [Si VI] outflows. The red solid line shows the Gaussian fit to the line profile, while the blue dashed lines corresponds to the seeing spatial profiles derived from observations of standard stars.
Current usage metrics show cumulative count of Article Views (full-text article views including HTML views, PDF and ePub downloads, according to the available data) and Abstracts Views on Vision4Press platform.
Data correspond to usage on the plateform after 2015. The current usage metrics is available 48-96 hours after online publication and is updated daily on week days.
Initial download of the metrics may take a while.