Fig. 2.
Download original image
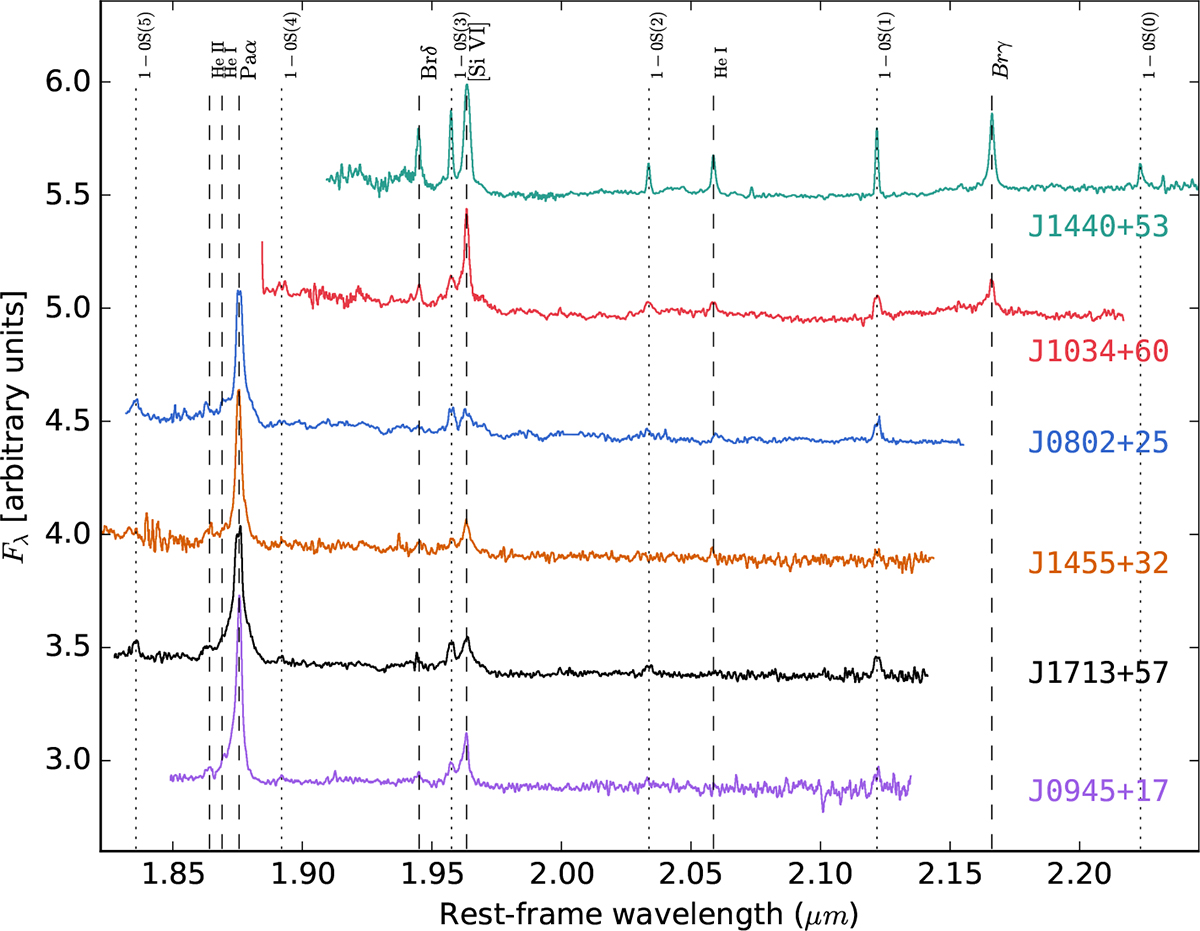
EMIR K-band nuclear spectra of the QSO2s showing the emission lines detected. The spectra were scaled in the Y-axis with the purpose of better visualization and smoothed using a 10-pixel boxcar. The spectra of the QSO2s are displayed from top to bottom in order of increasing redshift. Vertical dashed black lines indicate the position of the atomic lines, and dotted lines indicate the H2 lines.
Current usage metrics show cumulative count of Article Views (full-text article views including HTML views, PDF and ePub downloads, according to the available data) and Abstracts Views on Vision4Press platform.
Data correspond to usage on the plateform after 2015. The current usage metrics is available 48-96 hours after online publication and is updated daily on week days.
Initial download of the metrics may take a while.