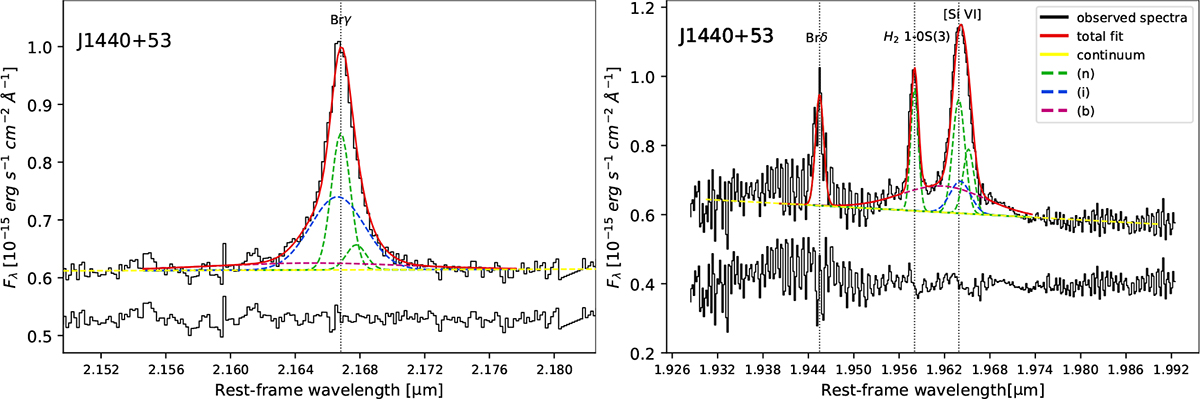
Fig. 3.
Download original image
Examples of emission line fits. The rest-frame spectrum of J1440+53 and residuals are shown in black, and the fit model is in red. Narrow (n), intermediate (i), and broad (b) components are shown in green, blue, and magenta. The spectra were smoothed using a 4-pixel boxcar, and residuals were scaled up from zero to reduce blank space. Vertical dotted lines correspond to the peak of the narrow component fit to each line.
Current usage metrics show cumulative count of Article Views (full-text article views including HTML views, PDF and ePub downloads, according to the available data) and Abstracts Views on Vision4Press platform.
Data correspond to usage on the plateform after 2015. The current usage metrics is available 48-96 hours after online publication and is updated daily on week days.
Initial download of the metrics may take a while.