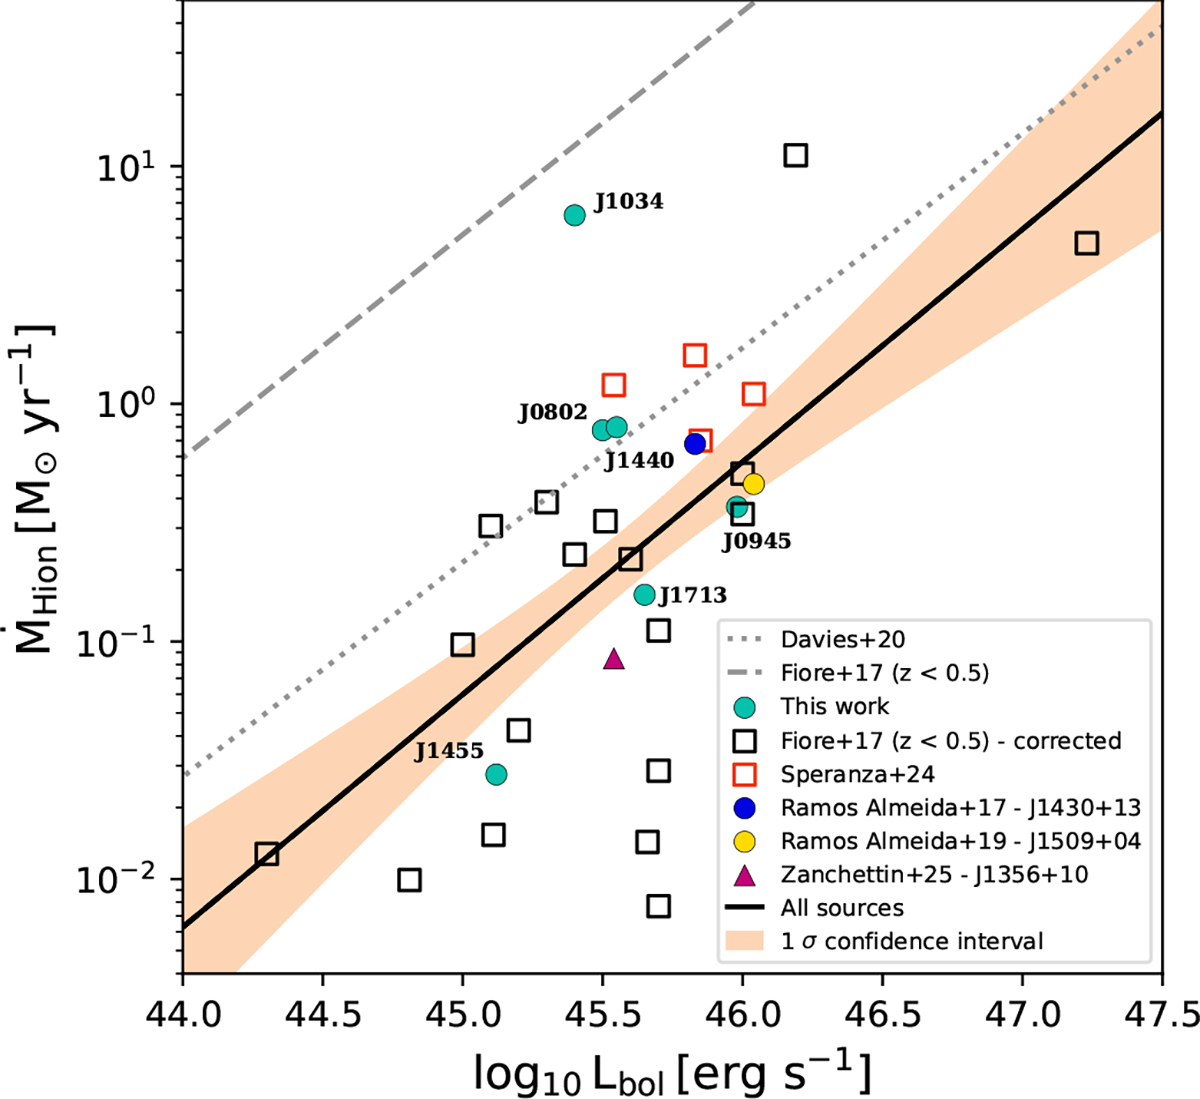
Fig. 4.
Download original image
Relation between ṀHion and Lbol. Turquoise points are our ionized mass outflow rates (ṀHion), calculated from either Paα or Brγ and using TR-based electron densities. Data of other QSO2s are shown with different colors and symbols. Open squares are mass outflow rates from Fiore et al. (2017), divided by 130 (see text). The dashed and dotted gray lines are the scaling relations from Fiore et al. (2017) and Davies et al. (2020), respectively, and the solid black line is the linear fit to all the data points included in the plot. The orange shaded area represents the 1σ confidence interval of the fit.
Current usage metrics show cumulative count of Article Views (full-text article views including HTML views, PDF and ePub downloads, according to the available data) and Abstracts Views on Vision4Press platform.
Data correspond to usage on the plateform after 2015. The current usage metrics is available 48-96 hours after online publication and is updated daily on week days.
Initial download of the metrics may take a while.