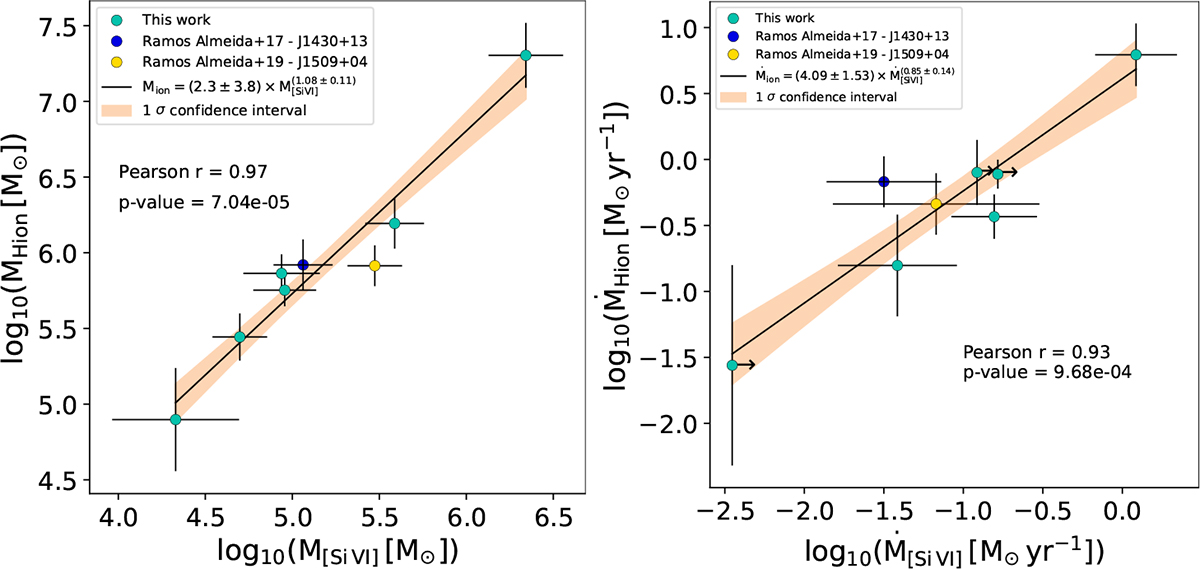
Fig. 5.
Download original image
Total ionized (Hion) versus [Si VI] gas outflow mass (left panel) and mass outflow rate (right panel). Turquoise circles are the QSO2s studied here, with outflow masses and mass rates calculated with TR electron densities, and blue and yellow circles are the QSO2s J1430+13 and J1509+04 from Ramos Almeida et al. (2017, 2019). Solid black lines are the corresponding fits to the data, and the orange shaded area represents the 1σ confidence interval of the fit. The Pearson correlation coefficient and the associated p-value are indicated in each panel.
Current usage metrics show cumulative count of Article Views (full-text article views including HTML views, PDF and ePub downloads, according to the available data) and Abstracts Views on Vision4Press platform.
Data correspond to usage on the plateform after 2015. The current usage metrics is available 48-96 hours after online publication and is updated daily on week days.
Initial download of the metrics may take a while.