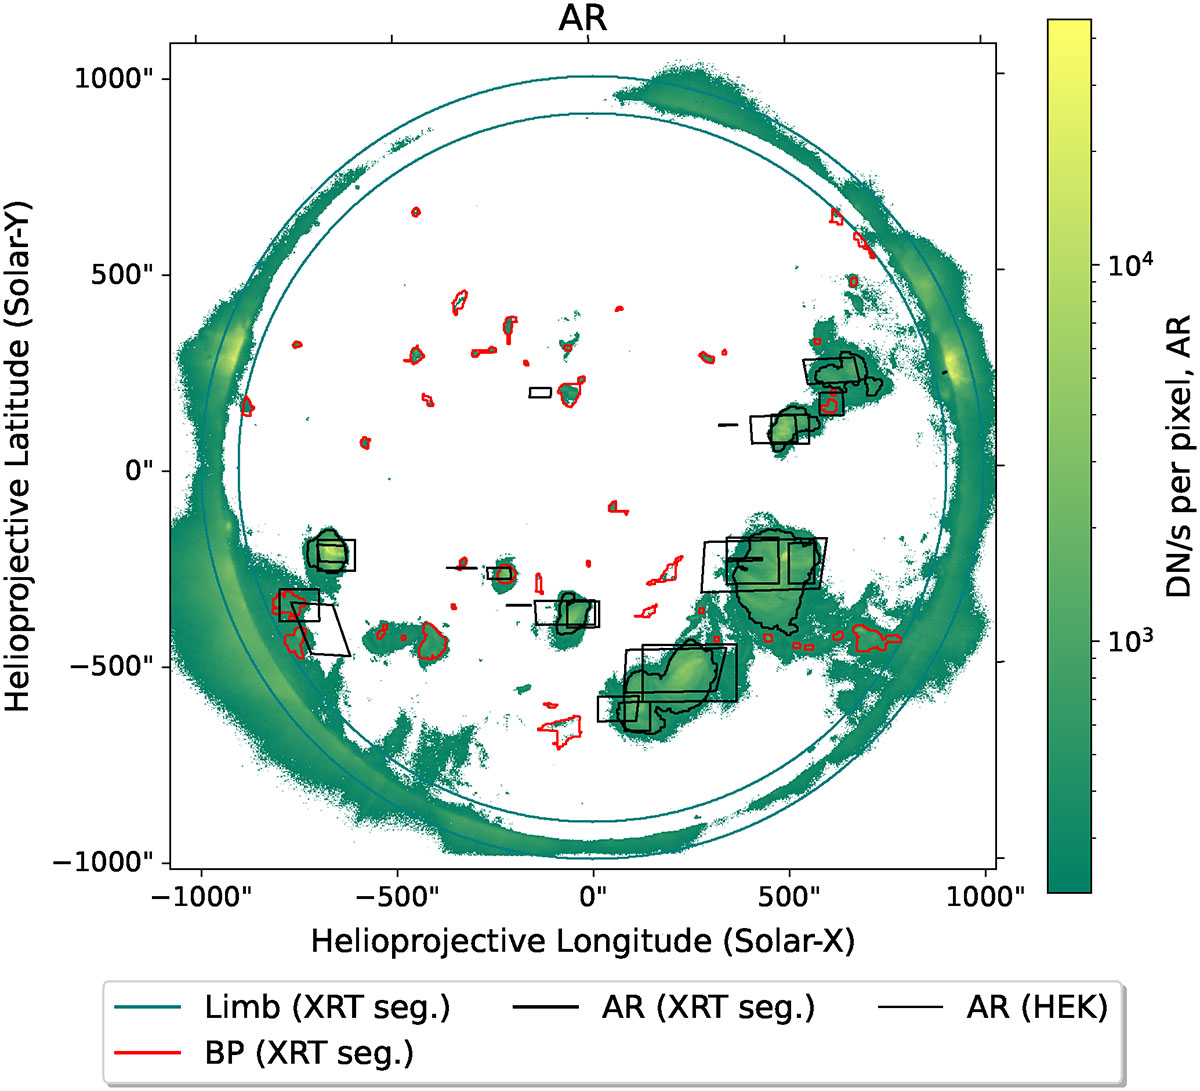
Fig. 10.
Download original image
Hinode/XRT image during quiescent-Sun observation with highlighted pixels showing the AR component (green gradient) (Sect. 3.4) identified from spectral fitting in Sect. 3.3.1. The solar-limb boundaries, shown by the green circles, are taken from the Hinode/XRT segmentation maps. The inner boundary defines the reference area used in the filling-factor calculations. The black and red contours correspond to active regions and bright points, respectively, as identified in the Hinode/XRT segmentation database (Adithya et al. 2021). The active regions simultaneously detected by various solar instruments and registered in the HEK (Hurlburt et al. 2012) are shown as black bounding boxes.
Current usage metrics show cumulative count of Article Views (full-text article views including HTML views, PDF and ePub downloads, according to the available data) and Abstracts Views on Vision4Press platform.
Data correspond to usage on the plateform after 2015. The current usage metrics is available 48-96 hours after online publication and is updated daily on week days.
Initial download of the metrics may take a while.