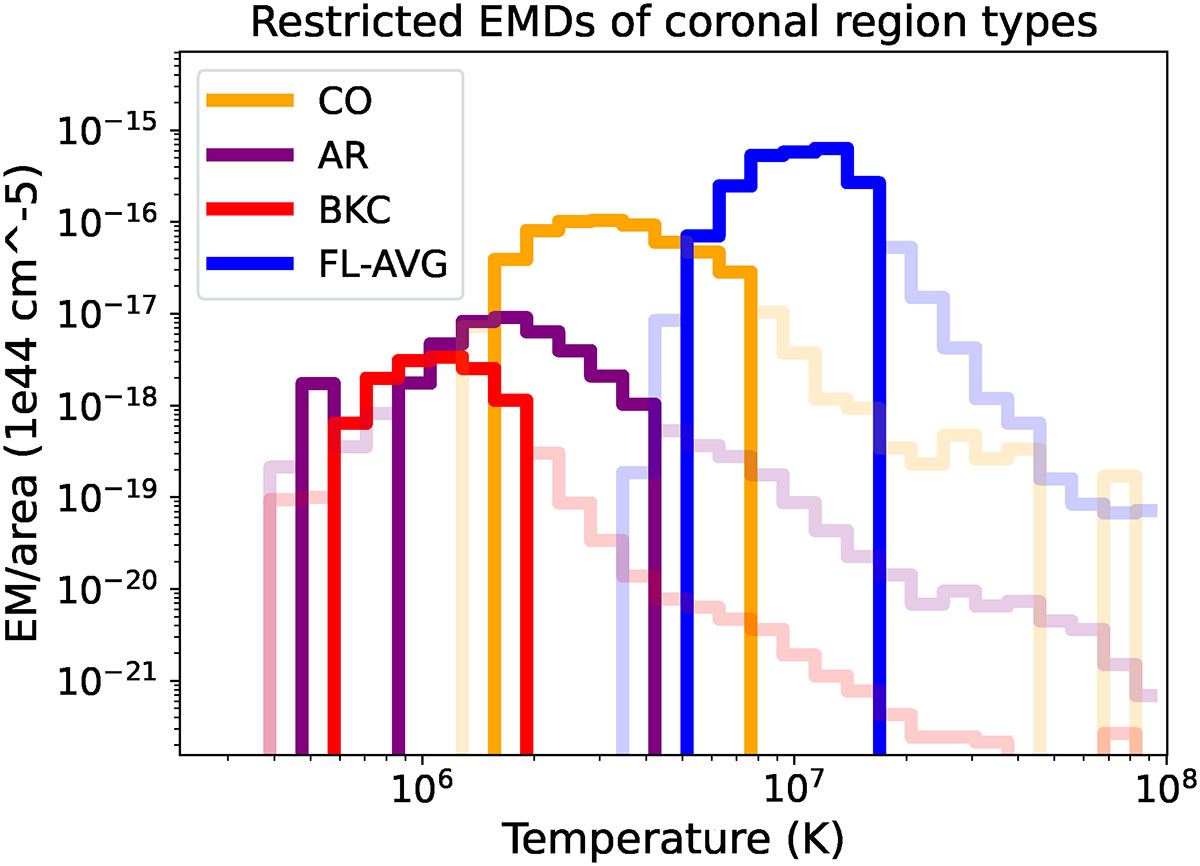
Fig. C.1.
Download original image
Emission measure distributions of the BKC, AR, CO and FL-AVG regions as described in Sect. 1. The opaque lines are the restricted distributions we use in this paper (described in Sect. 3.2), and the transparent lines show those parts of the original Yohkoh/SXT EMDs that we have discarded. The original EMDs are thus the combination of the opaque and transparent bins, and are also shown in Fig. 1.
Current usage metrics show cumulative count of Article Views (full-text article views including HTML views, PDF and ePub downloads, according to the available data) and Abstracts Views on Vision4Press platform.
Data correspond to usage on the plateform after 2015. The current usage metrics is available 48-96 hours after online publication and is updated daily on week days.
Initial download of the metrics may take a while.