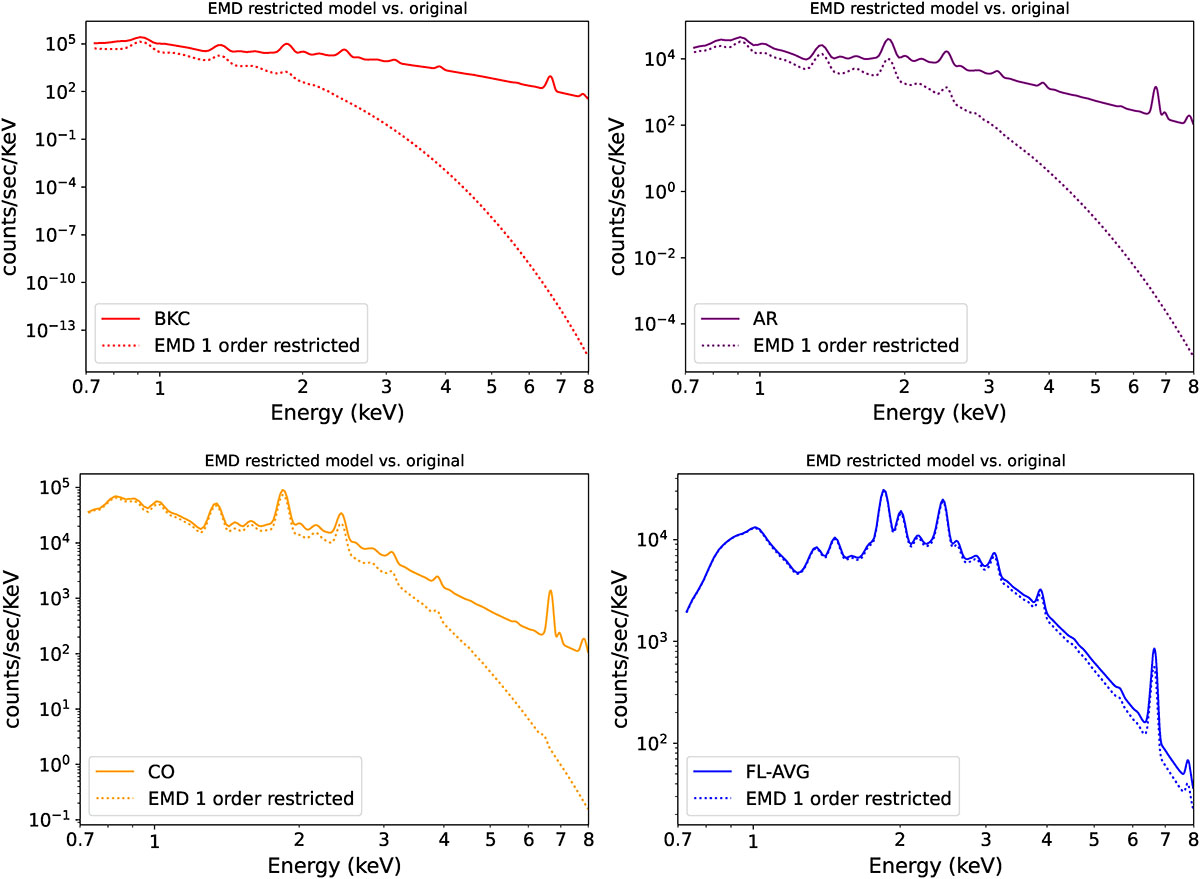
Fig. D.1.
Download original image
Comparison between composite SaXS spectral models in XSPEC derived from the full (solid lines) and restricted (dashed lines) emission measure distributions for the main coronal region types defined in Sect. 3.2. Colors indicate the region type: red for the background corona (BKC), purple for active regions (AR), yellow for cores (CO), and blue for the averaged flares (FL-AVG).
Current usage metrics show cumulative count of Article Views (full-text article views including HTML views, PDF and ePub downloads, according to the available data) and Abstracts Views on Vision4Press platform.
Data correspond to usage on the plateform after 2015. The current usage metrics is available 48-96 hours after online publication and is updated daily on week days.
Initial download of the metrics may take a while.