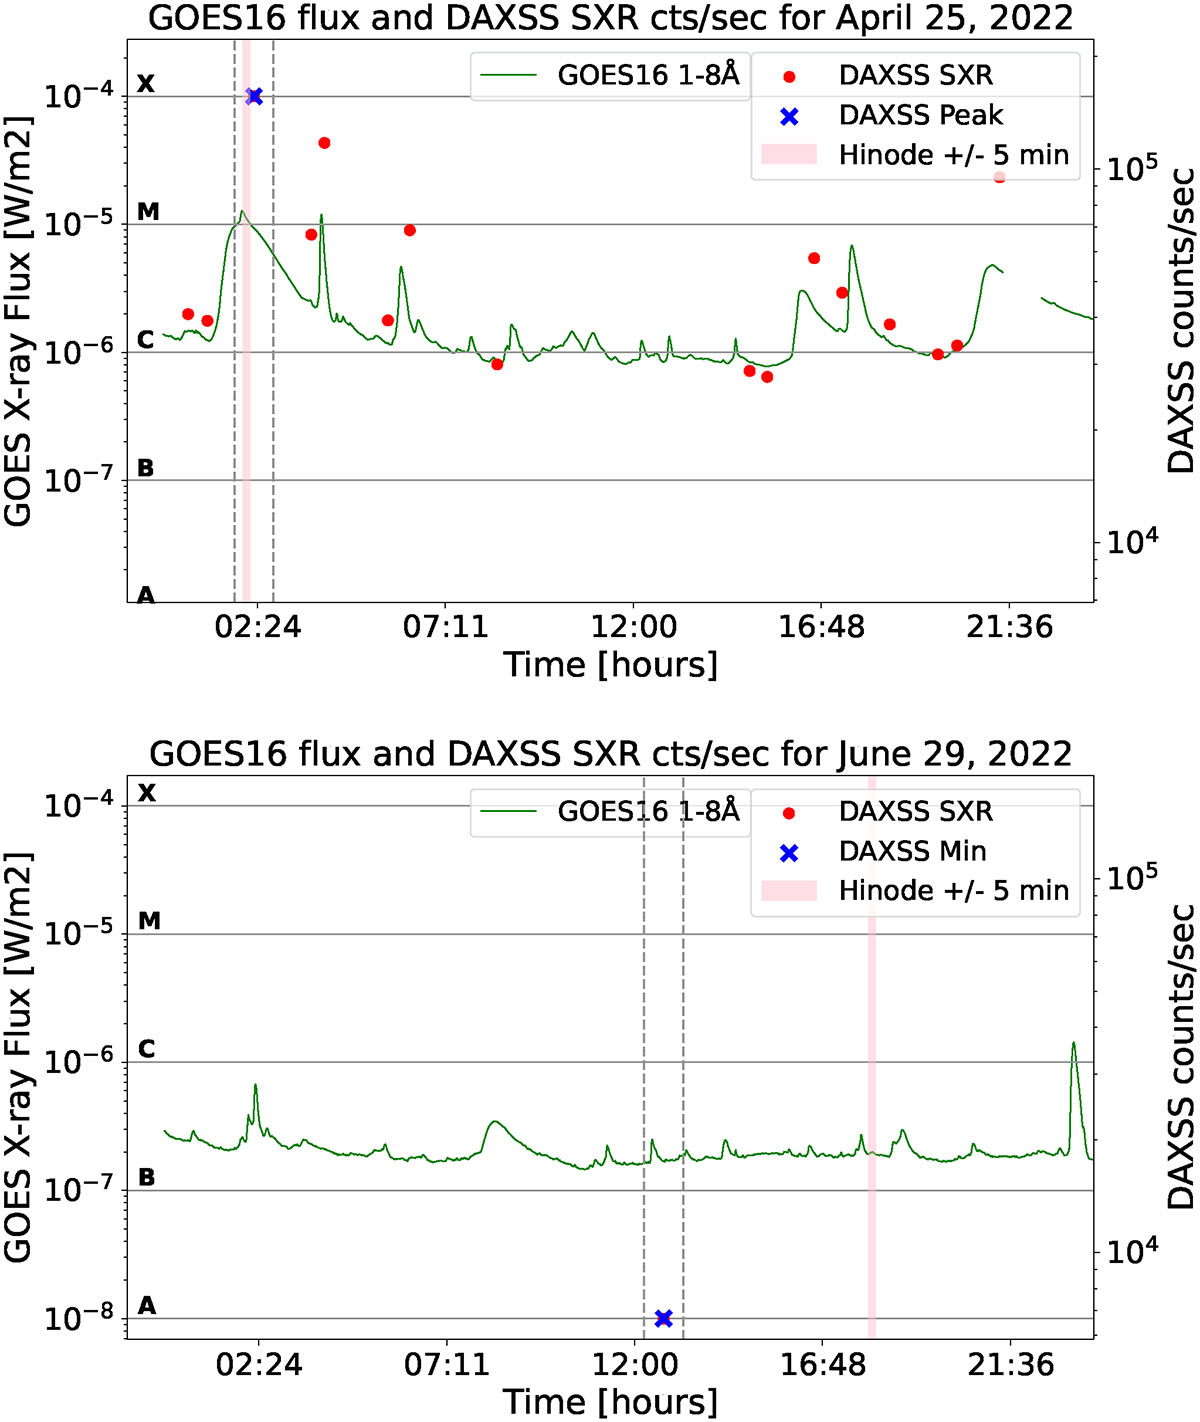
Fig. 3.
Download original image
GOES X-ray flux in 1–8 Å band (green) and DAXSS count rates for April 25, 2022 and June 29, 2022. Horizontal gray lines demarcate the GOES flare classes A, B, C, M, and X. The epochs of the DAXSS spectra selected for analysis in this paper are marked in the DAXSS light curve as blue crosses, and vertical dashed lines indicate the one-hour exposure time of the spectra. The Hinode/XRT synoptic images used to verify the SaXS method correspond to the time period indicated by the vertical pink band.
Current usage metrics show cumulative count of Article Views (full-text article views including HTML views, PDF and ePub downloads, according to the available data) and Abstracts Views on Vision4Press platform.
Data correspond to usage on the plateform after 2015. The current usage metrics is available 48-96 hours after online publication and is updated daily on week days.
Initial download of the metrics may take a while.