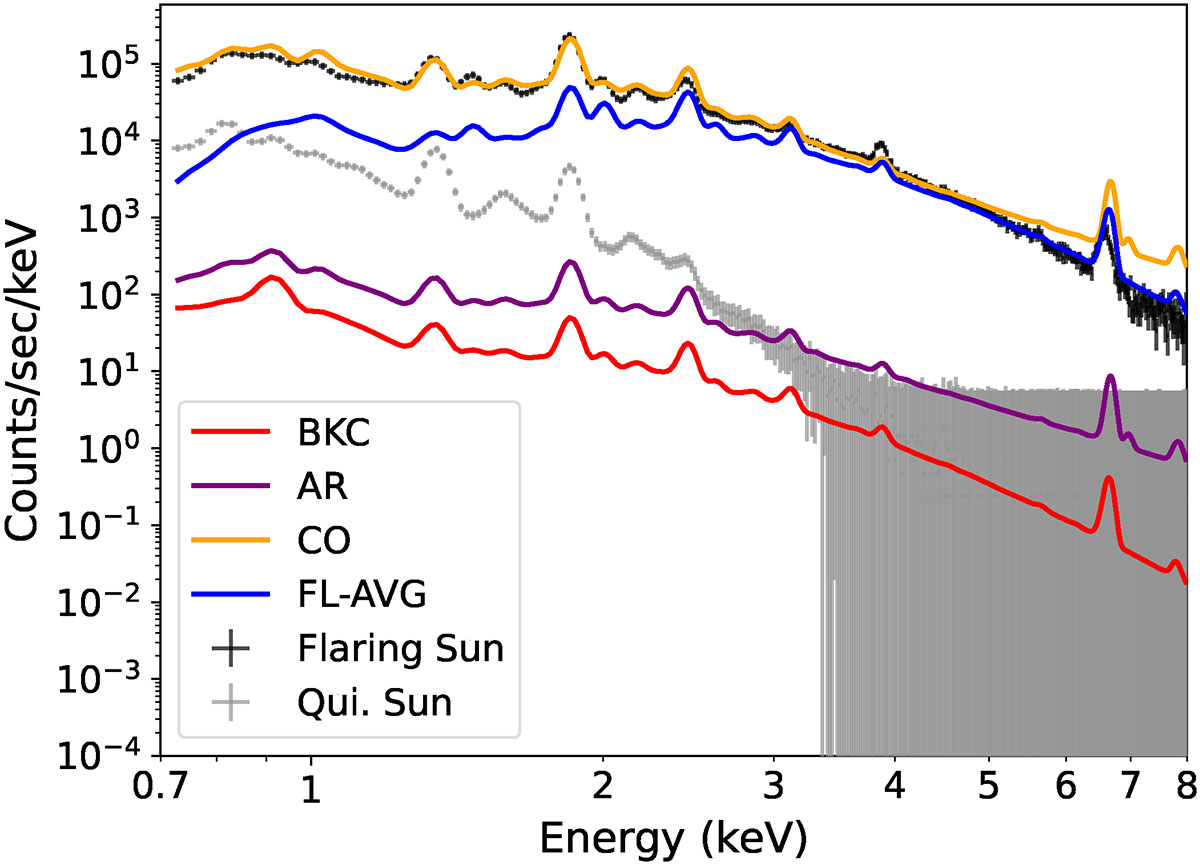
Fig. 4.
Download original image
DAXSS spectra corresponding to the lowest and highest count rates in the DAXSS light curve along with arbitrarily scaled SaXS models of the various types of coronal regions. This demonstrates the steeper slope of the solar spectra compared with the spectrum of all types of coronal region which indicates an over-contribution of low-signal EM bins (see text in Sect. 3.2).
Current usage metrics show cumulative count of Article Views (full-text article views including HTML views, PDF and ePub downloads, according to the available data) and Abstracts Views on Vision4Press platform.
Data correspond to usage on the plateform after 2015. The current usage metrics is available 48-96 hours after online publication and is updated daily on week days.
Initial download of the metrics may take a while.