Fig. 2
Download original image
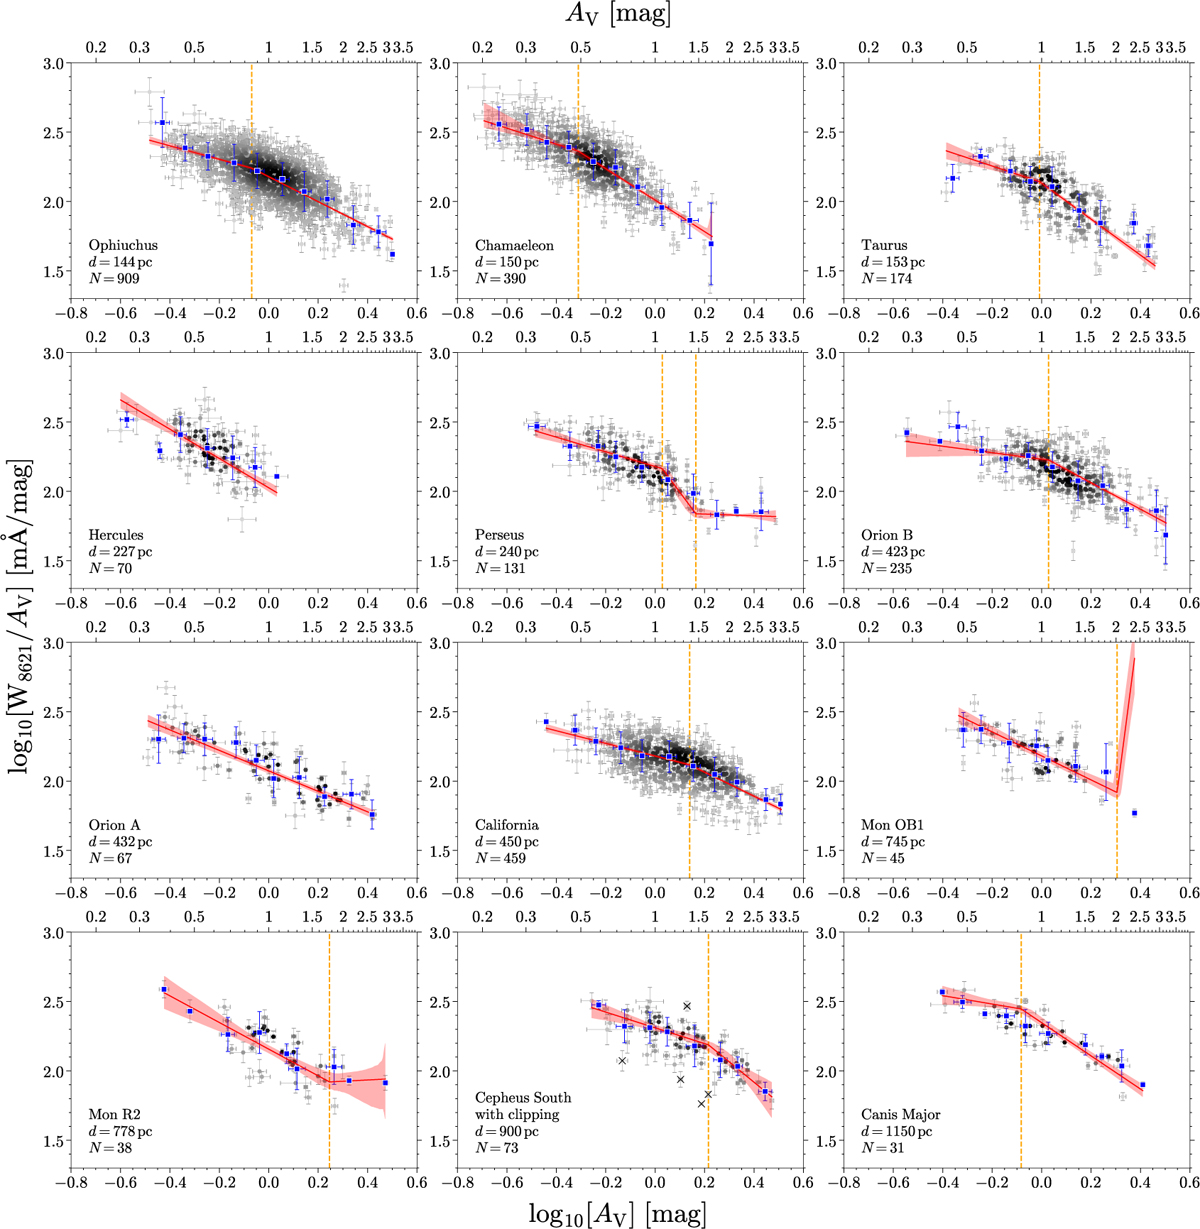
Variation in log10(W8621/AV) as a function of log10(AV) for each target cloud. The corresponding AV scale is shown at the top of each panel. The points are color-coded by their number density, estimated via a Gaussian KDE. The blue squares represent the median log10(W8621/AV) in bins of log10(AV) (from −0.8 to 0.6 with a step of 0.1). The solid red line and shaded region show the selected PLM and its 99.7% credible interval, respectively. The vertical dashed orange lines indicate the knot locations (see Sect. 3.1). The full PLM fitting results with np = 1−4 for each cloud can be found in Fig. B.1. For Cepheus South, the points marked with black crosses were clipped as outliers and excluded from the fit (see Sect. 4 for details). Each panel is labeled with the cloud name, distance, and the number of sightlines.
Current usage metrics show cumulative count of Article Views (full-text article views including HTML views, PDF and ePub downloads, according to the available data) and Abstracts Views on Vision4Press platform.
Data correspond to usage on the plateform after 2015. The current usage metrics is available 48-96 hours after online publication and is updated daily on week days.
Initial download of the metrics may take a while.