Fig. 5
Download original image
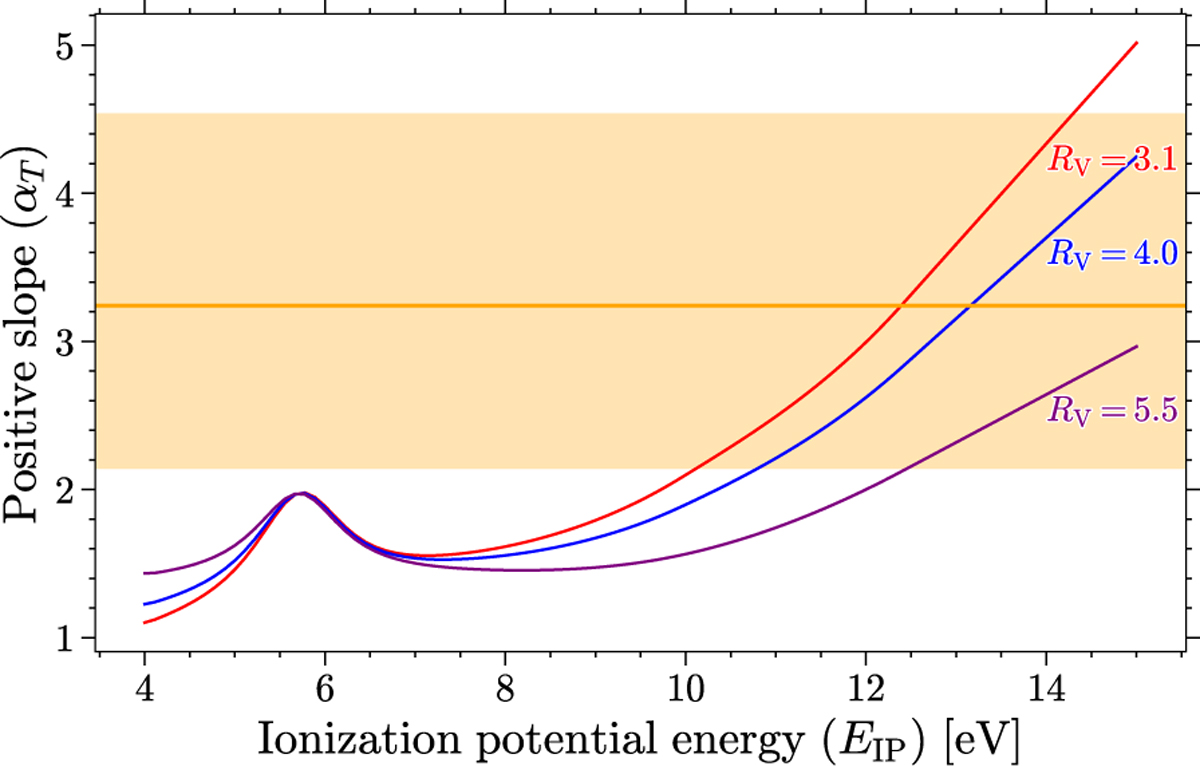
Theoretical relation between the ionization potential (EIP) of a DIB carrier and the expected observational slope (αT) from the PIE model of S97. The relation is plotted for three different RV = 3.1,4.0, and 5.5. The vertical orange line and shaded region represent our measured value of αT for DIB λ8621 (from Fig. 4) and its 1σ uncertainty, respectively. The intersection of our measurement with the RV = 3.1 curve implies EIP ≈ 12 eV.
Current usage metrics show cumulative count of Article Views (full-text article views including HTML views, PDF and ePub downloads, according to the available data) and Abstracts Views on Vision4Press platform.
Data correspond to usage on the plateform after 2015. The current usage metrics is available 48-96 hours after online publication and is updated daily on week days.
Initial download of the metrics may take a while.