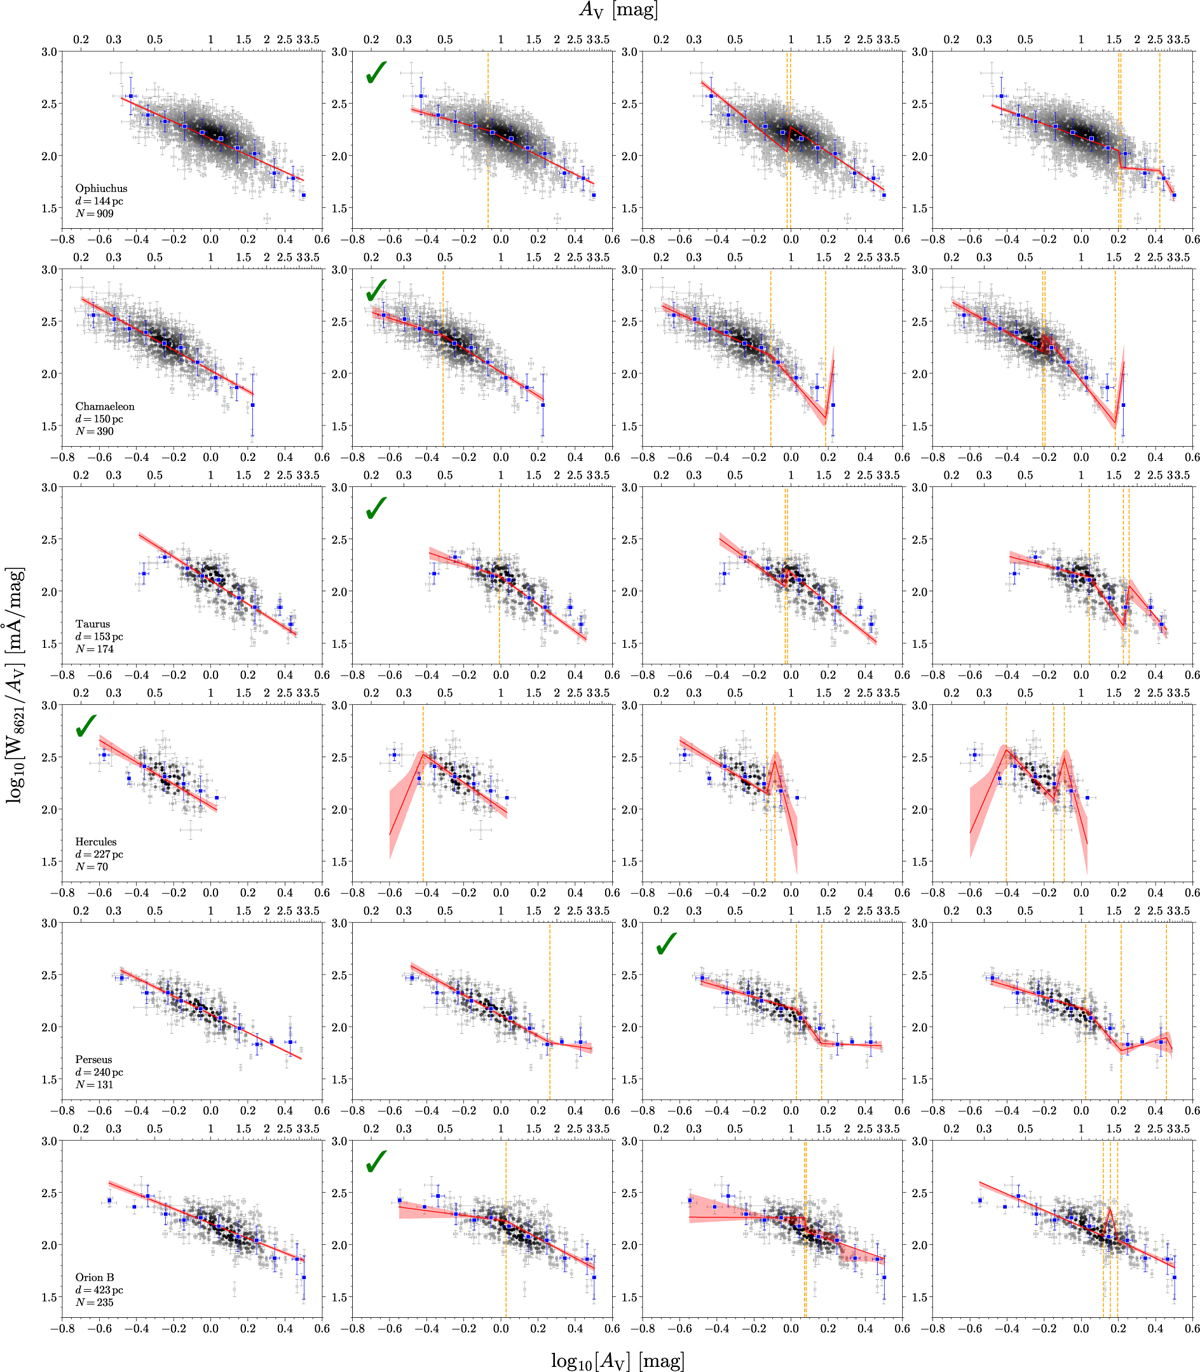
Fig. B.1
Download original image
Fitting results of the piecewise linear model (PLM) with np = 1−4 for each target cloud. The fit models are shown as red lines with shaded confidence intervals, overlaid on the individual measurements. The median trend of log10(W8621/AV) as a function of log10(AV) is shown by the blue squares. The locations of the knots (k) for each PLM are indicated by dashed orange lines. The model selected as optimal for each cloud is marked with a green check mark. The cloud name, distance, and number of sightlines used in the fit are also marked for each cloud.
Current usage metrics show cumulative count of Article Views (full-text article views including HTML views, PDF and ePub downloads, according to the available data) and Abstracts Views on Vision4Press platform.
Data correspond to usage on the plateform after 2015. The current usage metrics is available 48-96 hours after online publication and is updated daily on week days.
Initial download of the metrics may take a while.