Fig. 1.
Download original image
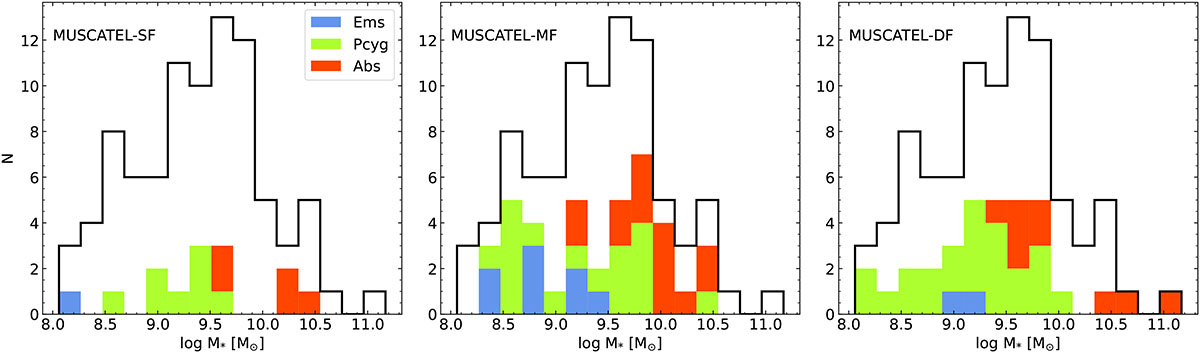
Stellar mass distribution of our preliminary sample of galaxies. The sample consists of 89 galaxies drawn from the MUSCATEL survey that exhibit Mg II in emission or absorption or a P-Cygni profile, determined after a careful inspection of their integrated spectra and their continuum-subtracted Mg II pseudo-narrowband image. A direct S/N threshold has not been applied. Each stacked histogram shows the distribution of the galaxies that belong to each one of the depth levels of the MUSCATEL survey (shallow field, medium field, and deep field; see Sec. 2), indicated in the top-left part of each panel. The black line shows the distribution of the full preliminary sample in all the panels. Stellar masses are calculated via SED fitting, as described in Sec. 2.2. The stacked histograms are color coded by the different spectral profiles shown in Mg II, as indicated in the legend.
Current usage metrics show cumulative count of Article Views (full-text article views including HTML views, PDF and ePub downloads, according to the available data) and Abstracts Views on Vision4Press platform.
Data correspond to usage on the plateform after 2015. The current usage metrics is available 48-96 hours after online publication and is updated daily on week days.
Initial download of the metrics may take a while.