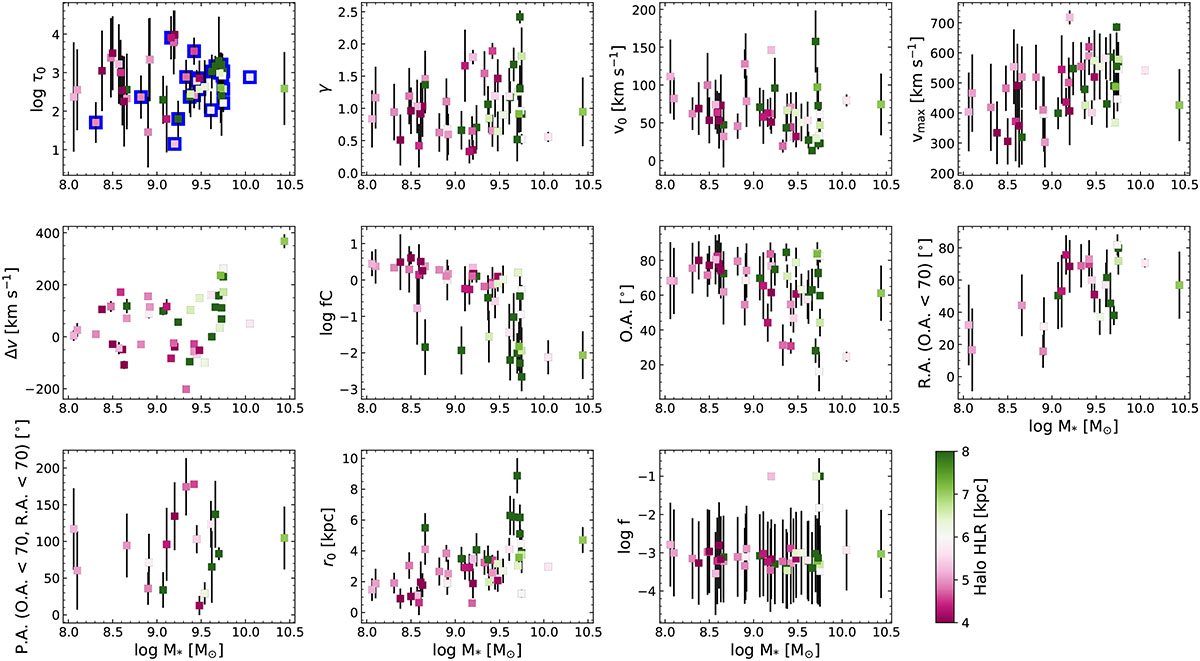
Fig. 10.
Download original image
Correlation of the best-fitting model parameters obtained with our outflow modeling scheme (see Appendix E.1) with the stellar mass of each galaxy, derived via SED fitting (see Sec. 2.2). The plots are color coded by the size of the Mg II halo of each galaxy, reported in Sec. 4, with green colors indicating halos in the extended regime of the distribution, and pink colors indicating more compact halos. The blue squares in the top-left panel indicate galaxies with a more robustly constrained τ0. For R.A., we only included galaxies with non-isotropic outflows (O.A. < 75°), and for P.A., we only considered galaxies with non-isotropic outflows (O.A. < 75°) that are also not seen nearly face on (R.A. < 75°).
Current usage metrics show cumulative count of Article Views (full-text article views including HTML views, PDF and ePub downloads, according to the available data) and Abstracts Views on Vision4Press platform.
Data correspond to usage on the plateform after 2015. The current usage metrics is available 48-96 hours after online publication and is updated daily on week days.
Initial download of the metrics may take a while.