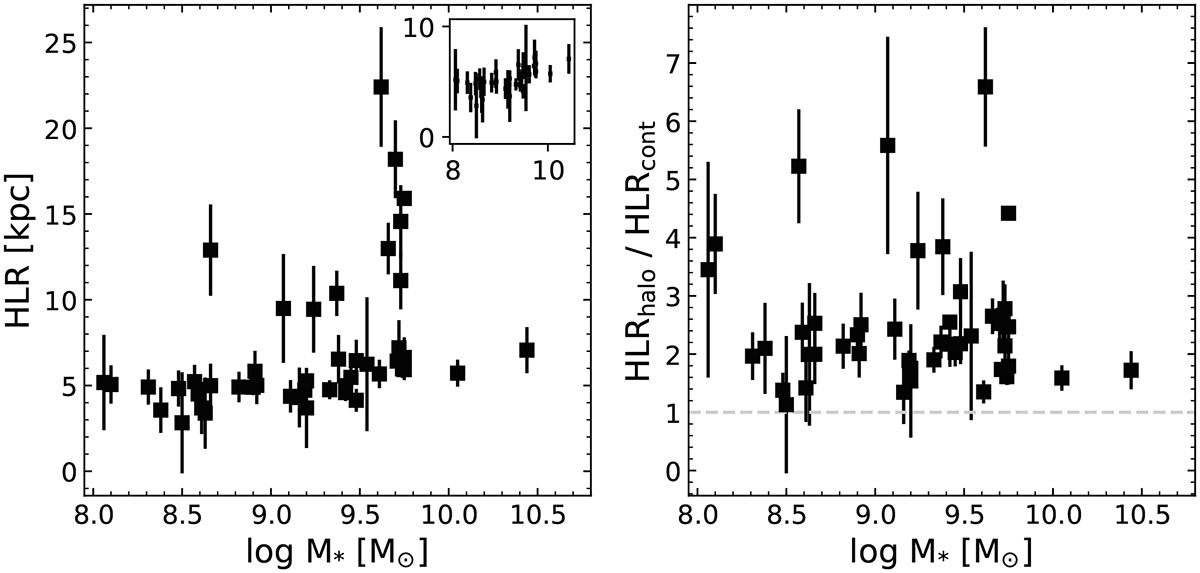
Fig. 13.
Download original image
Size of the Mg II emission halos after correcting by self-absorption as described in Sec. 4. The left panel shows the sizes of the Mg II emission halos as a function of the stellar mass of each galaxy, derived via SED fitting. The inset in the left panel shows a zoom-in to the HLR versus stellar mass relation for only those galaxies with HLR < 8 kpc. The right panel shows the ratio between the size of the Mg II emission halos and the size of the stellar component, as a function of the stellar mass of our sample galaxies. The horizontal dashed gray line shows the ratio of one for reference.
Current usage metrics show cumulative count of Article Views (full-text article views including HTML views, PDF and ePub downloads, according to the available data) and Abstracts Views on Vision4Press platform.
Data correspond to usage on the plateform after 2015. The current usage metrics is available 48-96 hours after online publication and is updated daily on week days.
Initial download of the metrics may take a while.