Fig. 2.
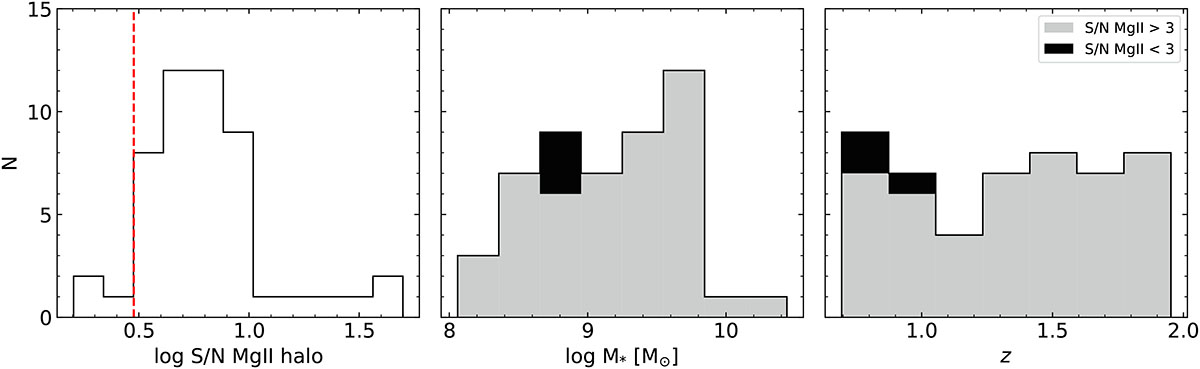
Download original image
Significance of the extended Mg II emission, stellar mass, and redshift distribution for the galaxies in our preliminary sample that exhibit a P-Cygni profile in Mg II. Left: significance of the extended Mg II emission in terms of its spatially integrated S/N for the 50 galaxies in our preliminary sample that exhibit a P-Cygni profile in Mg II. We further removed from our preliminary sample those galaxies where the integrated S/N of the modeled emission is lower than 3σ (indicated with a vertical dashed red line). Middle: stacked histogram that shows the stellar mass distribution of galaxies in the preliminary sample with a P-Cygni profile in Mg II. The gray histogram shows the stellar mass distribution of those galaxies where the significance of the Mg II emission is above the 3σ threshold. The black histogram shows the stellar mass distribution of galaxies below this significance threshold. Right: same as middle panel, but for the redshift distribution of the sample galaxies.
Current usage metrics show cumulative count of Article Views (full-text article views including HTML views, PDF and ePub downloads, according to the available data) and Abstracts Views on Vision4Press platform.
Data correspond to usage on the plateform after 2015. The current usage metrics is available 48-96 hours after online publication and is updated daily on week days.
Initial download of the metrics may take a while.