Fig. 3.
Download original image
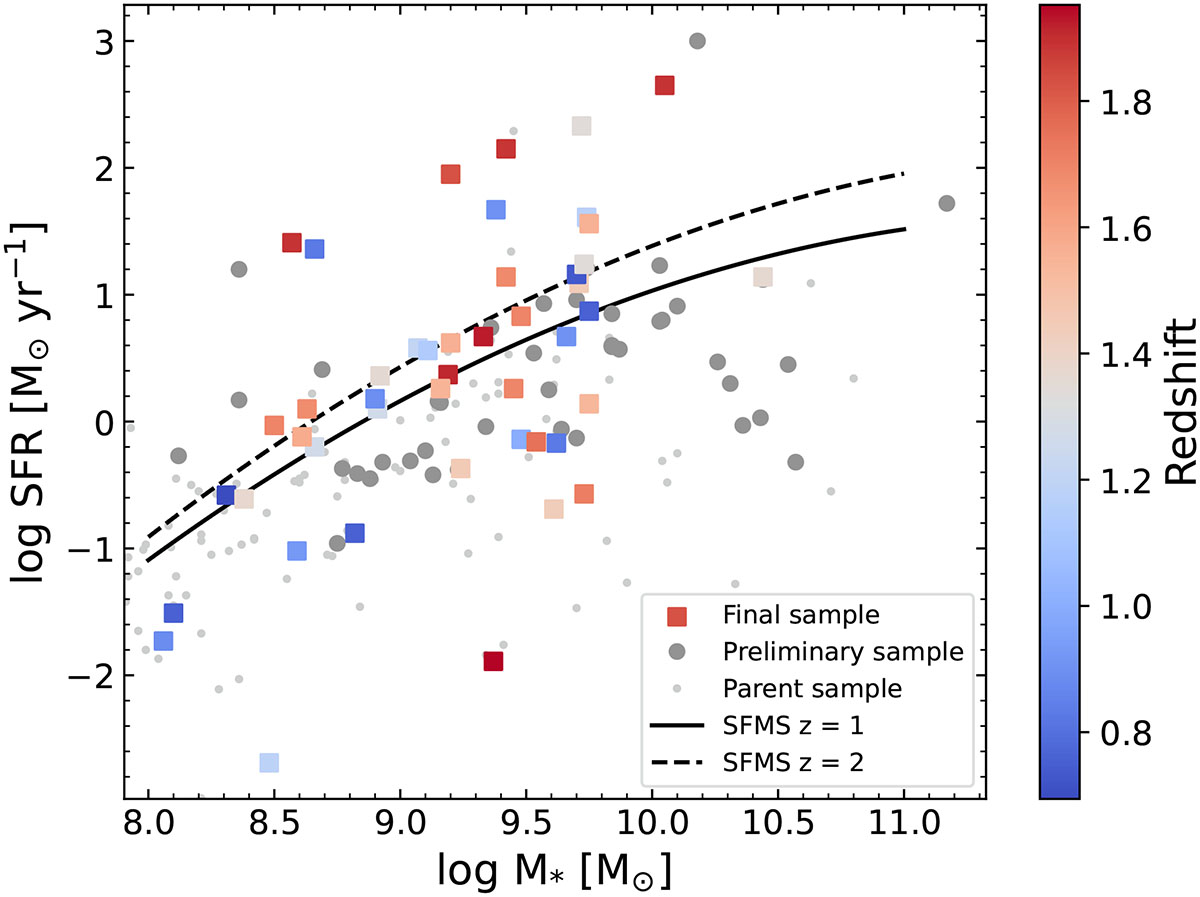
Star formation rate as a function of stellar mass for our sample galaxies. Both quantities were obtained via SED fitting (see Sec. 2.2). Our final sample of 47 galaxies that exhibit a P-Cygni profile and a significant detection of modeled extended emission is shown with squares, color coded by redshift. The preliminary sample is shown as dark gray circles, and the original parent sample is shown as smaller light gray dots. For reference, we show the SFMS as measured by Popesso et al. (2023) for z = 1 (solid) and z = 2 (dashed) by collecting different measurements of the SFMS for a wide range of redshifts.
Current usage metrics show cumulative count of Article Views (full-text article views including HTML views, PDF and ePub downloads, according to the available data) and Abstracts Views on Vision4Press platform.
Data correspond to usage on the plateform after 2015. The current usage metrics is available 48-96 hours after online publication and is updated daily on week days.
Initial download of the metrics may take a while.