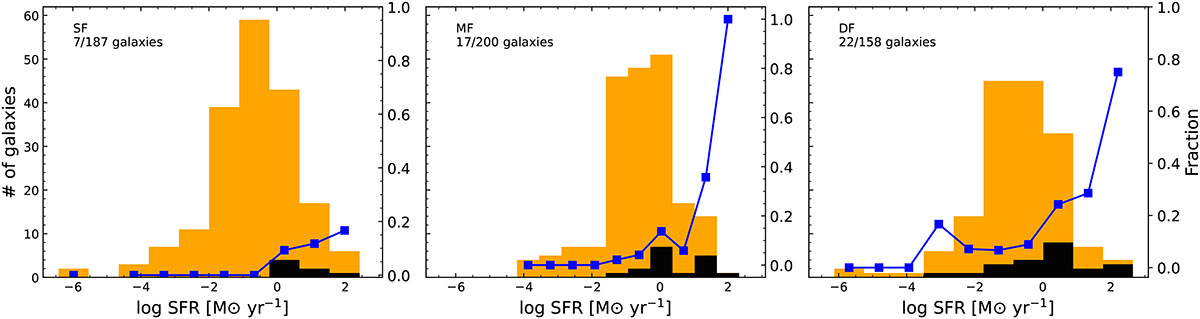
Fig. F.1.
Download original image
Comparison of the SFR distributions for our final sample of galaxies (black) and our parent sample (orange), separated by depth of the field (SF, MF, and DF; see MUSCATEL description in Sec. 2.1). The blue line shows the fraction of galaxies from the parent sample in our final sample, in each SFR bin. The right-side y-axis indicates the fraction shown by the blue line. In the top-left corner of each panel is indicated the field depth, and the number of galaxies in the final/parent sample.
Current usage metrics show cumulative count of Article Views (full-text article views including HTML views, PDF and ePub downloads, according to the available data) and Abstracts Views on Vision4Press platform.
Data correspond to usage on the plateform after 2015. The current usage metrics is available 48-96 hours after online publication and is updated daily on week days.
Initial download of the metrics may take a while.