Fig. 4.
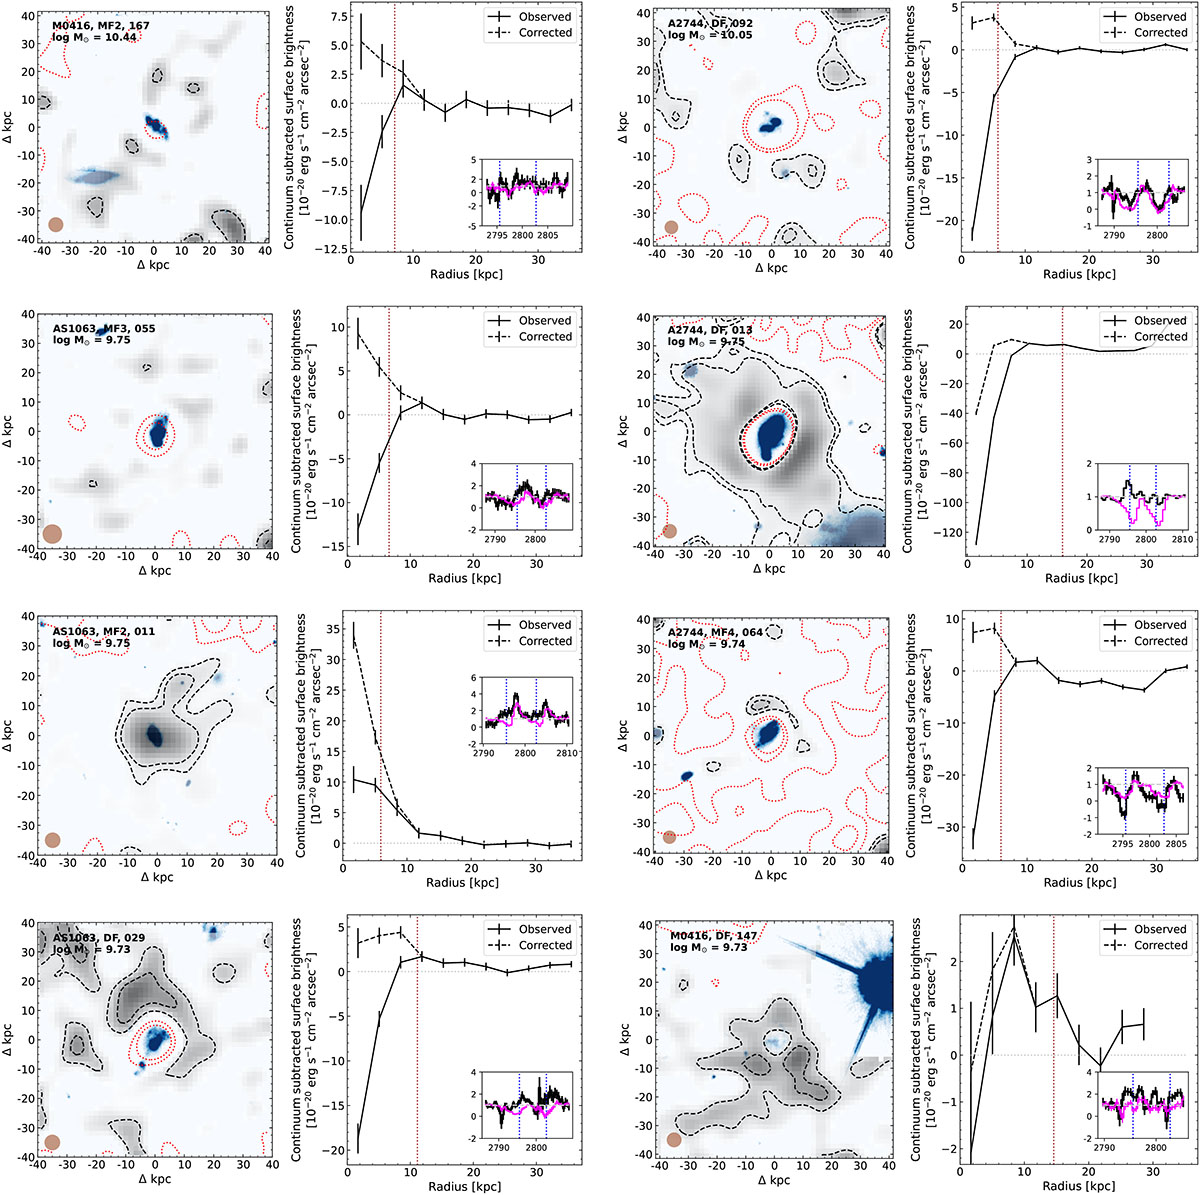
Download original image
Compilation of continuum-subtracted Mg II pseudo-narrowband images (gray color scale) and HST F814W images (blue color scale, probing the stellar light) for our final sample of galaxies that exhibit a P-Cygni profile in Mg II as well as a significant detection of extended Mg II emission. Galaxies are sorted by stellar mass in descending order. The continuum-subtracted Mg II pseudo-narrowband images were computed by collapsing the MUSE data across the wavelength axis for wavelengths that enclose the full P-Cygni profile of the Mg II doublet for a field of view of 80 × 80 kpc2. The brown circle in the bottom-left part of the panel shows the size of the MUSE PSF. The black contours show the 1-σ and 2-σ detection levels of Mg II net emission in the pseudo-narrowband images. The red contours show the 2-σ and 4-σ levels of Mg II net absorption in the pseudo-narrowband images. For visualization purposes, the continuum-subtracted Mg II pseudo-narrowband images have been smoothed using a Gaussian kernel with a FWHM of 1 arcsec. For each galaxy, we also show the radial profile of the Mg II emission as observed in the data (solid) and after correcting by self-absorption using our best-fitting model (dashed; see Sec. 4). The vertical dotted brown line shows the half-light radius measured for the self-absorption corrected radial profiles. The inset shows the Mg II spectrum extracted from the MUSE data cube for each galaxy, across the full modeled region (black) and a small central aperture of radius ![]() . The figure is continued with the rest of our sample galaxies in Appendix A.
. The figure is continued with the rest of our sample galaxies in Appendix A.
Current usage metrics show cumulative count of Article Views (full-text article views including HTML views, PDF and ePub downloads, according to the available data) and Abstracts Views on Vision4Press platform.
Data correspond to usage on the plateform after 2015. The current usage metrics is available 48-96 hours after online publication and is updated daily on week days.
Initial download of the metrics may take a while.