Fig. 5.
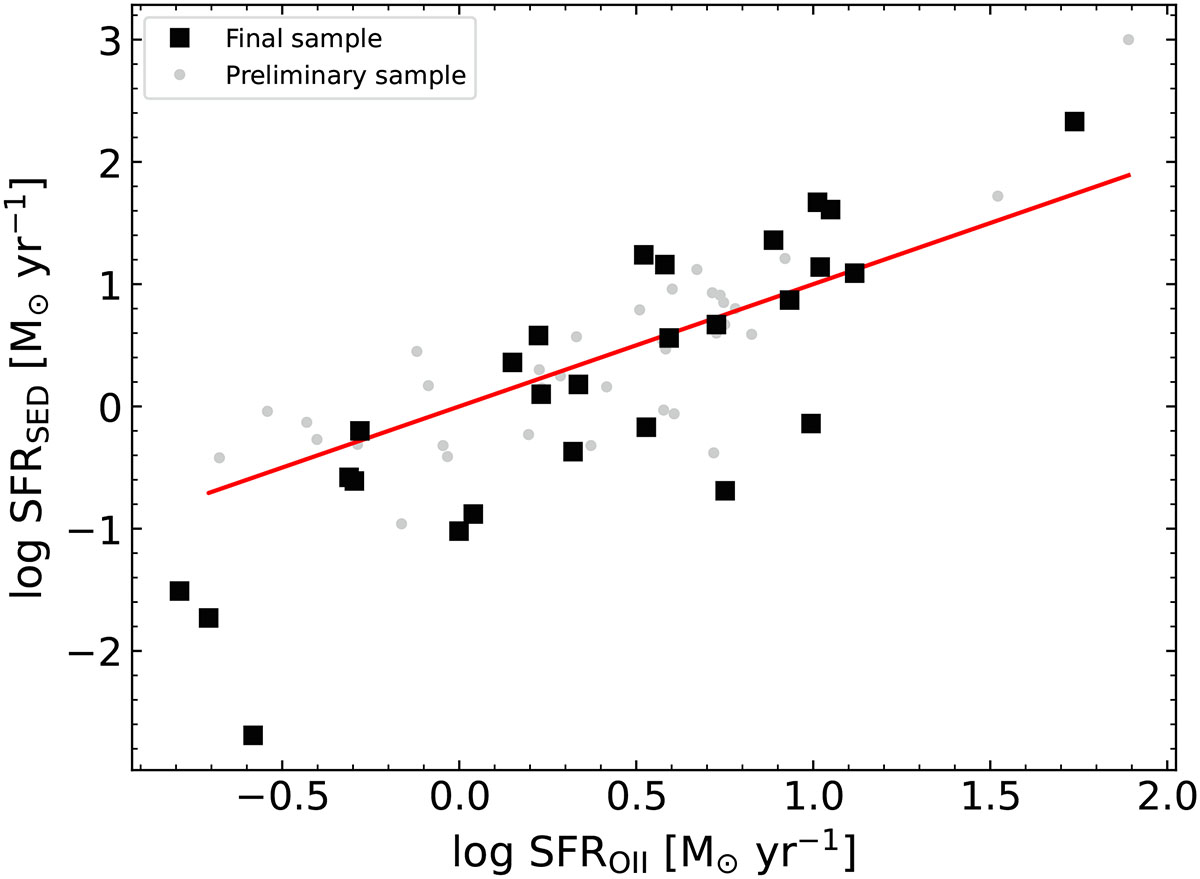
Download original image
Comparison of the SFR values derived for our sample galaxies obtained via SED fitting (see Sec. 2.2 for details) and from the [O II] luminosity of each galaxy (see Sec. 3.3.1). The black squares show the SFR values for galaxies in our final sample, and the gray dots show the SFR values for galaxies in the preliminary sample, for the subset of galaxies at z ≲ 1.48, where the [O II] doublet falls well within the MUSE wavelength range. The red line shows the identity for reference. Table D.1 provides these measurements for each galaxy in our final sample.
Current usage metrics show cumulative count of Article Views (full-text article views including HTML views, PDF and ePub downloads, according to the available data) and Abstracts Views on Vision4Press platform.
Data correspond to usage on the plateform after 2015. The current usage metrics is available 48-96 hours after online publication and is updated daily on week days.
Initial download of the metrics may take a while.