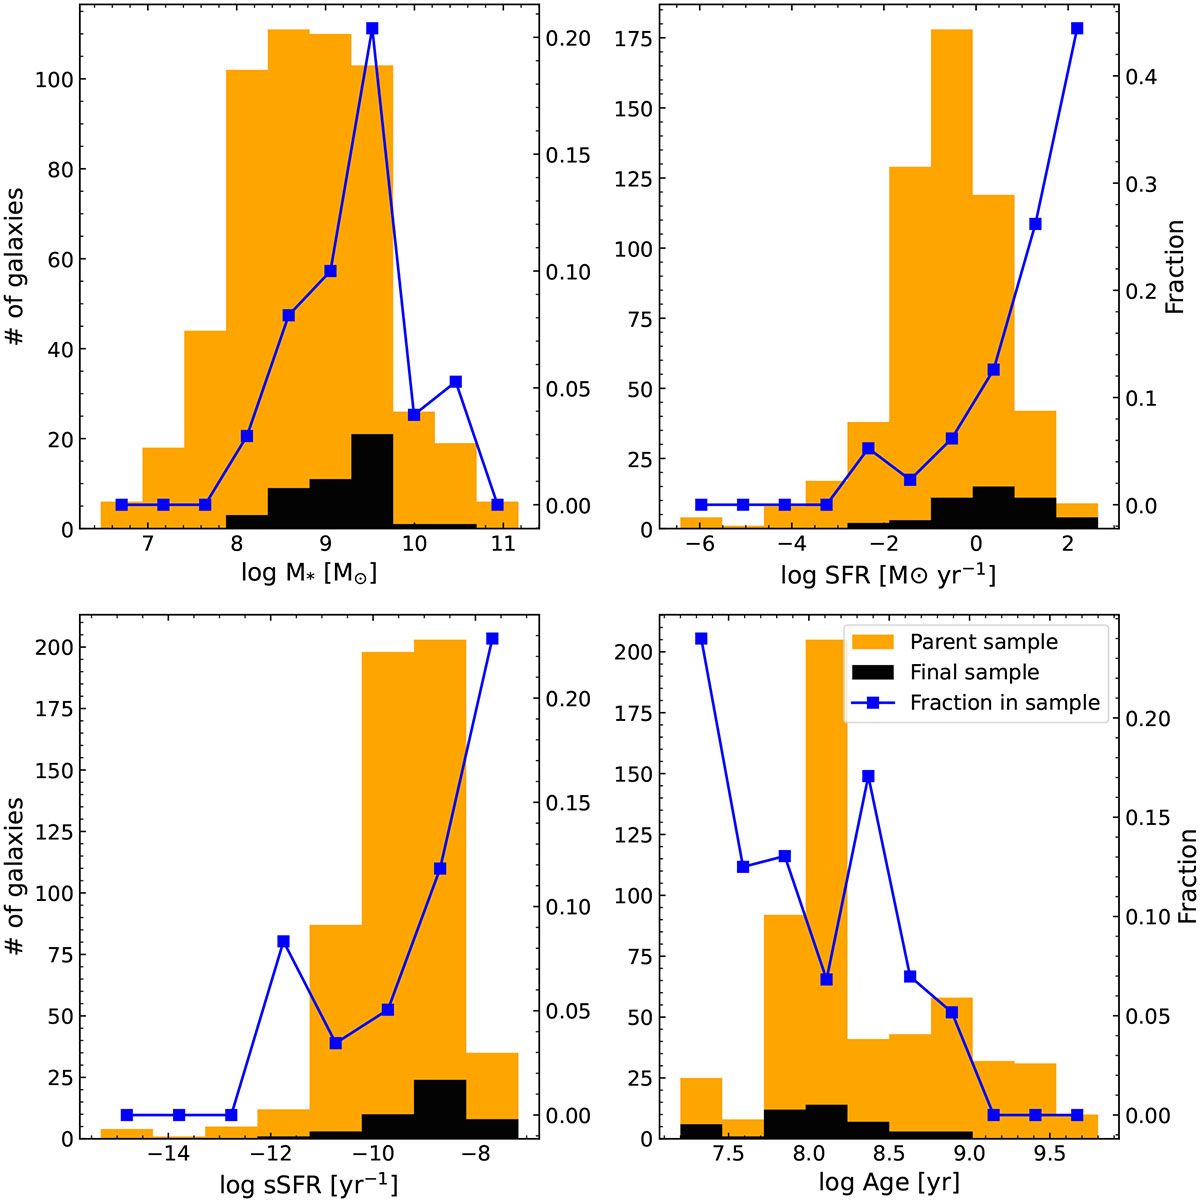
Fig. 6.
Download original image
Comparison of the stellar mass, SFR, sSFR, and age distributions for our final sample of galaxies (black) and our parent sample (orange). The blue line shows the fraction of galaxies from the parent sample in our final sample in each bin of the relevant quantity for each panel. The right side y-axis indicates the fraction shown by the blue line.
Current usage metrics show cumulative count of Article Views (full-text article views including HTML views, PDF and ePub downloads, according to the available data) and Abstracts Views on Vision4Press platform.
Data correspond to usage on the plateform after 2015. The current usage metrics is available 48-96 hours after online publication and is updated daily on week days.
Initial download of the metrics may take a while.