Fig. 7.
Download original image
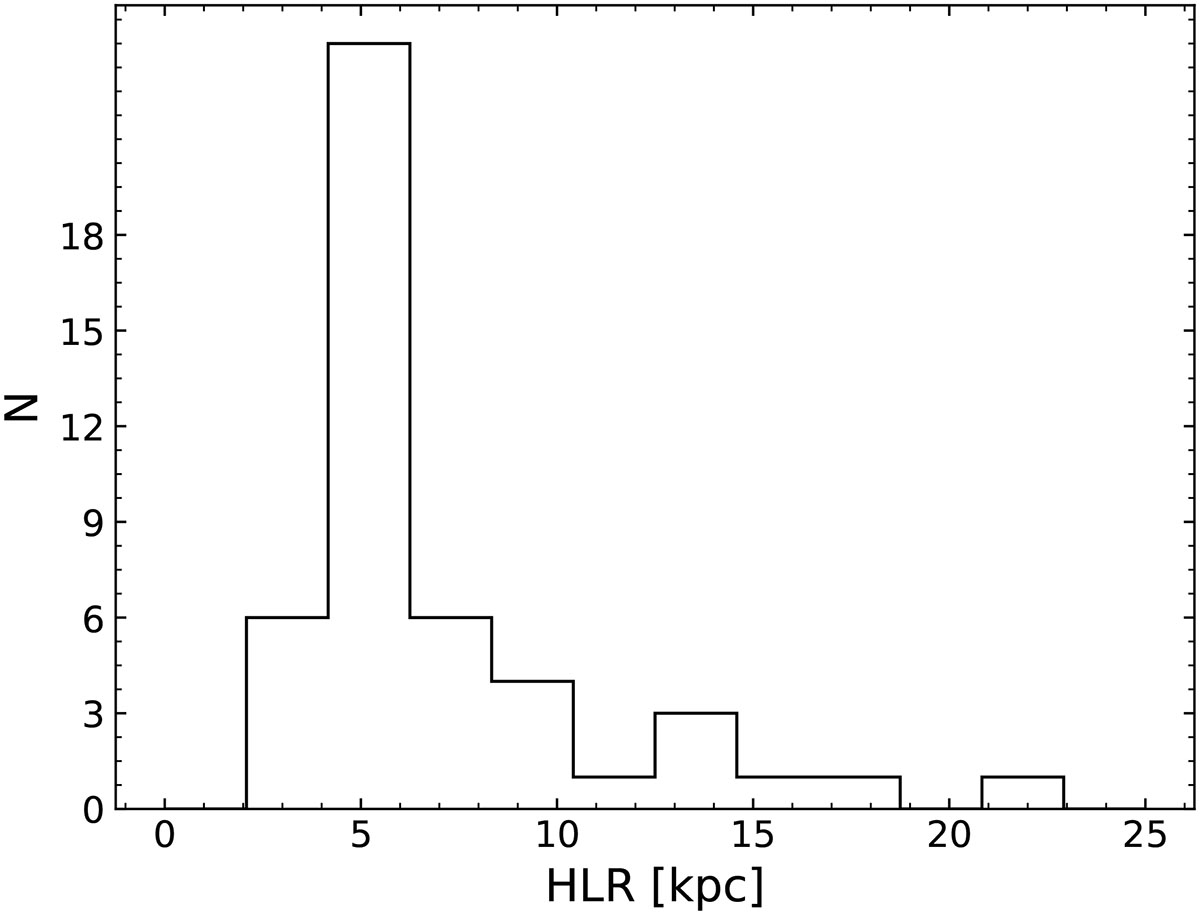
Distribution of the sizes (in terms of HLR) of the Mg II halos. The halos were corrected by self-absorption before measuring their HLR using the absorption component of the best-fitting model. The radial profiles of the absorption-corrected Mg II emission halos are shown with a dashed line in Fig. 4. The HLR of each galaxy is provided in Table D.1.
Current usage metrics show cumulative count of Article Views (full-text article views including HTML views, PDF and ePub downloads, according to the available data) and Abstracts Views on Vision4Press platform.
Data correspond to usage on the plateform after 2015. The current usage metrics is available 48-96 hours after online publication and is updated daily on week days.
Initial download of the metrics may take a while.